Subsubsection 1.4.5: MC2H 50 vs Meta (Meta900 prior) 50 Up Subsection 1.4: Correlations Section 2: CMC 

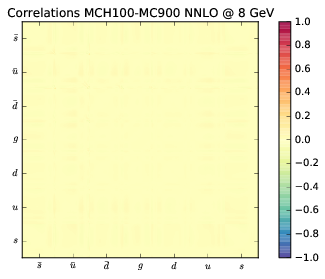
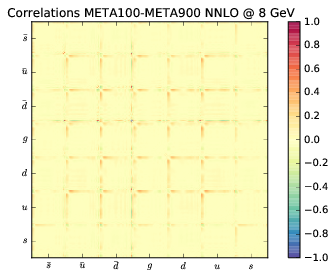
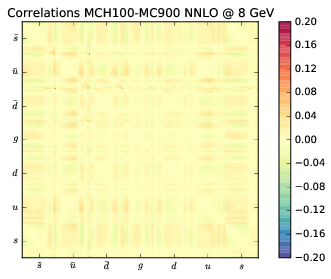
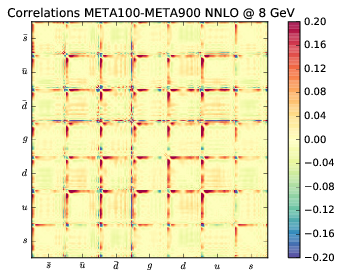
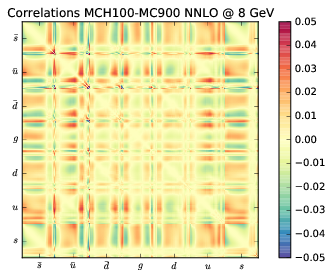
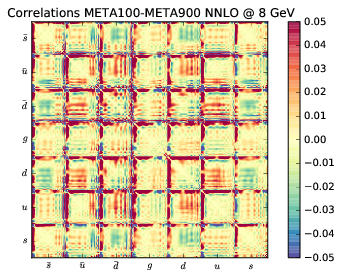
1.4.6 MC2H 100 vs Meta (Meta900 prior) 100

These are all the same correlation differences, but plotted at different scales. The sampling grid is 100 logaritmically spread.
(a) MC2H [Source]
figure plots/correlations/mchv1corr_100.png
(b) Meta [Source]
figure plots/correlations/correlations_meta_ann/meta100corr_100.png
Figure 436 Correlation differences between prior at 100% max scale
(a) MC2H [Source]
figure plots/correlations/mchv1corr_20.png
(b) Meta [Source]
figure plots/correlations/correlations_meta_ann/meta100corr_20.png
Figure 437 Correlation differences between prior at 20% max scale
(a) MC2H [Source]
figure plots/correlations/mchv1corr_5.png
(b) Meta [Source]
figure plots/correlations/correlations_meta_ann/meta100corr_5.png
Figure 438 Correlation differences between prior at 5% max scale
 Subsubsection 1.4.5: MC2H 50 vs Meta (Meta900 prior) 50 Up Subsection 1.4: Correlations Section 2: CMC