| The ATLAS Level 2 Trigger
|
Performance Studies on the EM Calorimeter.
Physics Processes - Basic Concepts.
|
When a high-energetic electron (i.e with energy more than 10 MeV) passes through a very heavy material (for example lead(Pb) with Z=82) it loses energy via the Bremsstrahlung process. During this process, the particle interacts with the electromagnetic (Coulomb) field of a nucleus and, as a result, emmits a photon, which is also of a high energy. In the case of a photon now traveling through the heavy material, because of its high energy, pair production (e+ e-) is the dominant process (again there is need for the nuclear field to be present). Then, the new particles can undergo Bremsstrahlung (in the case of the electron) or pair production (in the case of photon). With this proceedure, we end up with an electromagnetic shower. The shower will stop developing when the energy of the particle becomes lower than a threshold (critical energy Eo) so that the dominant process for lossing energy is now the ionization. For electrons, the critical energy is approximately:

which in the case of Pb, is around 7 MeV.
The next step is to measure the energy of the final-state particles. In the case of the sampling calorimetera material which is sensitive to ionazition (for example liquid argon LAr) is placed after the the absorber. The ionization is then measured as an electric signal at the electrodes.
|

|
|
The energy loss per unit of length travelled is a characteristic of the material and is called radiation length Xo :

Lead has a radiation length of 0.56 cm or, using the mass-density, 6.37 gr/cm^2.
The longitudinal shower maximum (expressed in units of radiation lengths) occurs at:

where Eo is the initial energy of the particle.
The transverse shower development is (of 95%) located in a cylinder with radius twice the Moliere radius:

Finally, the energy resolution of a calorimeter is:

where the first term is the stochastic term, the second term is a constant and the third term expresses the noise due to electronics or pile-up.
|
Construction of the ATLAS EM Calorimeter.
The ATLAS electromagnetic calorimeter is a sampling calorimeter with accordion geometry absorbers immersed in LAr.The accordion geometry minimizes the "dead zones", while the LAr is intrisically radiation hard.
It consists of 3 samplings. The way for defining the boundaries for each sampling is determined by the way we aquire the electronic signals (the clustering of the read-outs), rather than by any other geometrical and mechanical way!
- Sampling 1. The read-out cells have a size of (&Delta&phi x &Delta&eta)=(0.1x0.0031). Thus, we say they have the strip shape, forming what we call strip towers.
- Sampling 2. The cells have size of (&Delta&phi x &Delta&eta)=(0.0245x0.025) forming the square towers.
- Sampling 3. The cells have size of (&Delta&phi x &Delta&eta)=(0.0245x0.005) forming the trigger towers.
There is also the Pre-sampler before the first sampling. The primary purpose of the pre-sampler is to correct for energy loss of particles in inactive material before they enter the calorimeter. This is achieved by measuring the multiplicity of a particle shower that develop due to interactions with inactive material, mainly at the Inner Detector. Given the important amount of material in the ID the pre-sampler is a crucial support to the EM calorimeter to reconstruct the energy of the outgoing particles.
The barrel part of the EM Calorimeter is considered to cover the region 0<|&eta|<1.475 while the end-cap part covers the region 1.375<|&eta|<3.2
|

|
|
The folowing picture on the left was made using the ATLANTIS event display and shows the energy deposition into the 4 samplings of the EM Calorimeter. The blue lines are draw in order to give the shape of each cell. The energy measured in each cell is propotional to the yellow area inside this cell. Thus, with this view, we can only have relative comparisons between the cells.
The right hand-side picture gives the stereo view of one of the 32 in total modules of the Barrel EM Calorimeter.
Defining the pointing resolution - Formalism.
The trajectory of a charged particle inside a uniform magnetic field is a helix, if we ignore multiple scattering processes. Due to the fact that the magnetic lines of the solenoidal magnetic field surrounding the Inner Detector are paraller to the z-axis, highly energetic trajectories projected onto the (z, &rho) plane are -almost- straight.
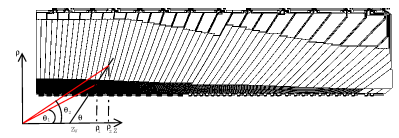
For our analysis, we define the resolution in terms of position and angle as is given in the following diagram:

We assumed that the center of the shower is approximately located at the middle of each sampling and the first and the second samplings are in a constant distant from the z axis ( &rho = const)
The next crucial point is the fact that the &theta angle given by the two samplings is calculated with respect to Z=0 . This is important, because the Z position of the interaction vertex can be found anywhere between ± 20cm away from Z=0.
Given the geometry of the &rho - z projection of the barrel EM Calorimeter, the interaction vertex can be calculated using the formulae:

|
|
In the case of the End-Cap EM Calorimeter, the same formulae hold. In this case, the z-position of each sampling is constant and we solve the equations accordingly. Attention to the ± signs must be paid when we switch between the two end-caps!
Results.
The following results have been produced using 25 GeV (30 GeV) single electron simulated events at low (high) luminosity. The events were then reconstructed using the 8.0.2 ATLAS software release. The recontucted values for each sampling are those which were reconstructed using the offline calorimeter software.
- Position and angle resolution
Gaussian sigma - Only Barrel Clusters included.
| Zv Resolution (cm) | Z1 Resolution (cm) | Z2 Resolution (cm) | &theta Resolution (rads) |
| Low Luminosity |
3.656 ± 0.095 | 0.095 ± 0.002 | 0.542 ± 0.010 | 0.014 ± 0.000 |
| High Luminosity |
3.686 ± 0.080 | 0.084 ± 0.002 | 0.539 ± 0.011 | 0.015 ± 0.000 |
The important conclusion derived by the above table is that, using the information only from the 2 samplings of the EM Calorimeter we can find the interaction vertex with an accuracy of 4 cm. This is also the case when we go to high luminosity events.
- Z vertex resolution as a function of &eta
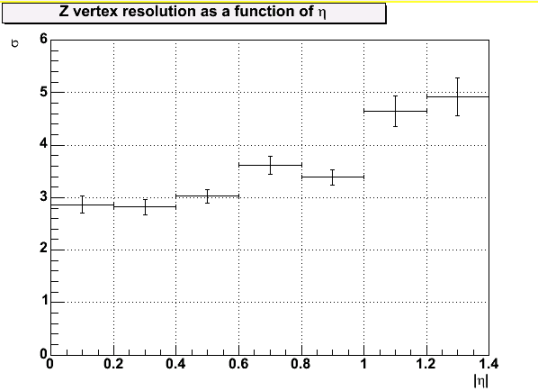
The Z-vertex resolution gets worse as the EM cluster approaches the edges of the barrel region. The difference is about 64%. The same behaviour appears in the high luminosity events.


