

![]()
![]()
![]()
![]()
![]()
![]()
![]()
![]()
8 Hour Transfer using Vanilla 2.4.19 TCP - 8th and 9th February 2003.
An iperf transfer was initiated using web100 and the results logged. The test setup was a machine (gig6) at Manchester and one at UCL (mbng3).
Tests were performed in both directions for 8 hours using iperf-1.6.5 and web100alpha 2.1. The web100 results were logged with logvars during the weeken of the 2nd week of Feb 2003 (8&9th). All tests were performed with nothing else in the link and the bottlenecks were at the nics themselves (1gb/sec).
iperf was configured to report results every 1 second, whilst web100 traps were set every 0.1 second
Results
UCL->MAN
iperf sender results, recv results.
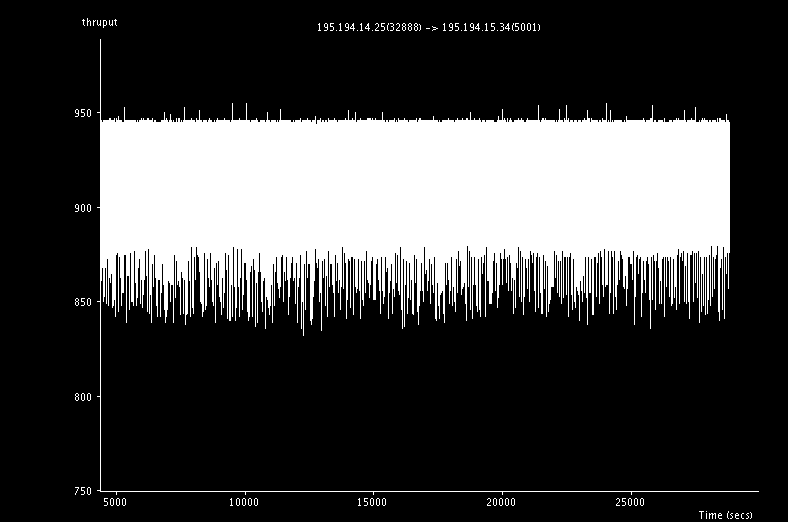
This graph shows the throughput as a function of time in mbit/sec. As you can see, we can get around 900mbits/sec using the standard implementation of tcp over this 6ms link. iperf itself states that it was able to achieve an average rate of 918mbit/sec over the 8hours.
Web100 results (zipped): sender, recver. (unzipped 21mbytes each!)
This graph is the same but using the web100 statistics. An InstaneousBW is the amount of data transferred divided by the duration in which that data was transferred and normalised to a second. More specially, it is DataBytesOut (Delta) * 8 / Duration (Delta).
One can see that it is slightly more variable than what is reported in iperf.
This graph shows the evolution of the cwnd as a function of time. The next graph shows the same thing but for the first 10 minutes of the transfer.
One can see the variability of the cwnd value from around 400kB to 1.2mB.
Plotting the cwnd agains the instbw shows the following structure:
- a linear regime where the cwnd is proportional to the instbw.
- a plateau where the throughput is being limited by the physical hardware of the gig nic. However, as the cwnd does not know about this limitation, it still grows.
- The kink between the two is the bandwidth delay product of the link.
- Other structure.. unknown!
This graph shows the cwnd value against he instbw for only when we have one or more SendStall events. A sendstall event basically tells us that the txqueuelen as set up in /sbin/ifconfig is too small and thus TCP determines this as a congestion signal (is it? or is it loss?) and does the appropiate post signal things (like halving the cwnd value).
The inverse of this graph (ie, plotting only the points with no sendstall signals) looks like this:
There is still a little cluster of points away from the main curve...
The above graph shows the curve when there are no CongestionSignals experienced. As congestion signal in web100 is
"The number of multiplicative downward congestion window
adjustments due to all forms of congestion signals,
including Fast Retransmit, ECN and timeouts. Note that
retransmission timeouts multiplicatively reduce the window
implicitly by setting ssthresh. In order to minimize
spurious congestion indications due to out of order
segments, CongstionSignals should be increment in
association with the Fast Retransmit algorithm."
This graph shows the cumulative number of sendstalls as a function of time. As you can see, there is a linear relation indicating that there is period sendstalls occuring due to buffer overruns on the txqueue. One possible investigation would be to alter the value of txqueuelen to minimise the number of sendstalls. As tcp treats sendstalls as a form of congestion, it halves the cwnd each time. Therefore reducing the throughput.
This graph shows the cumulation of congestion signals as a function of time. We get about 1 quarter more sendstalls than congestion signals per unit time.
To find out what is causing these congestion signals:
This shows the cumulative number of fastretrans as a fucntion of time. From the gradient of the graph, one can see that fast retransmits account for about quarter of the number of congestion signals experienced. The cause of a fast retrans is discussed in RFC2581. In summary, it is due to dupacks equally the dupack threshold (3) being recved by the sender. This could be due to lost packets or reordering on the network.
This plot shows the cumulative number of timeouts during the transfer. As you can see, there is only one occurance very near the start which was most likely due to the slow start algorithm. There are no timeouts during the transfer.
This shows the cumulative number of dupacks being recved by the sender. We can deduce that about we get just under 10 dupacks coming in per second from the transfer. This is enough to trigger congestion avoidance in tcp three times per second. (rtt=6ms, get 1000/6 rtts in one second ~150rtts. so about 1 congestion avoid every 15 rtts!).
So what is causing these congestion avoidances? It's not sendstalls - although this does have an effect (quantify).
The udp tests suggest that the combination of the line and the hosts give a loss rate of about 0.014% (ie one in every 7142 odd packets). If we were sending at about the same rate per second of packets as in the udp tests (81,100) this would account for about 10 losses every second. This seems consistent with the tcp numbers calculated above!
So what is the other congestion signals causing that aren't accounted for in the other 3/4s?
Another variable is called OtherReductions:
"The number of congestion window reductions made as a result
of anything other than AIMD congestion control algorithms.
All window reductions MUST be counted as either
CongestionSignals or OtherReductions. Examples of
non-multiplicative window reductions include experimental
algorithms such as Vegas."
There were no AbruptTimeouts, SubsequentTimeouts nor CurTimeoutCount's. There were also no QuenchRcvd's.
This graph shows that there appears to be a steady increase in the number of slow starts as we progress through the transfer. Under Reno and NewReno, slowstart is only meant to happen AFTER a loss through a timeout. This is to prevent the starvation of the flow due to reordering on the network. From the gradient (graph shows cumulative) we get about 7 slow starts per second.
According to the Web100 draft paper, the slowstart counter is an indication of:
"The number of times the congestion window has been
increased by the Slow Start algorithm. See RFC 2581."
This graph shows the correlation between the number of slow starts and number of sendstalls experienced for each second fo the transfer as reported by web100.
This graph shows the frequency of the number of pkts going out from the sender.
This graph shows the variation in the rtt recorded by web100 (note that there is a limit to the resolution of the web100 variatbles). The funny lines from the avertt is caused by using 32bit counters.
This shows the profile of the instaneous rtts throughout the 8h. It has quite a large spread ranging from 6ms to 10ms. Unfortunately, it peaked; meaning that there's a spread of values.
A CongestionOverCount is:
"The number of congestion events which were 'backed out' of
the congestion control state machine such that the
congestion window was restored to a prior value. Backed out
congestion events can not be backed out of
CongestionSignals and PreCongSumCwnd, etc."
And Other
This is a zoomed graph of the last four variables of the graph above. It shows that we only get timeouts (well, one) and nothing else.
Question: How can i determine whether the acks are for consequtive packets or not? - if it is, it generates a fastretransmit, which should be viewable below:
![]()
It appears that even though we can get upto 300 or 500 dupacks per second, we only ever experience one fastretran per second. (it's delta) So there's a lot of reordering, but not a lot of lost packets (or severly reordered packets, ie >=3 dupacks).
| Wed, 23 July, 2003 13:07 |
Room D14, High Energy Particle Physics, Dept. of Physics & Astronomy, UCL, Gower St, London, WC1E 6BT