Subsubsection 1.4.1: MC2H 30 vs Meta 30 Up Subsection 1.4: Correlations Subsubsection 1.4.3: MC2H 100 vs Meta 100 

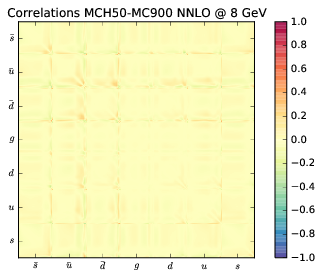
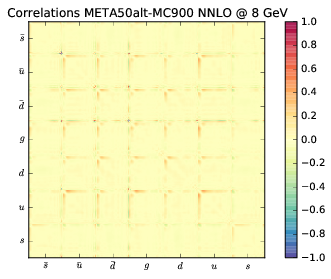
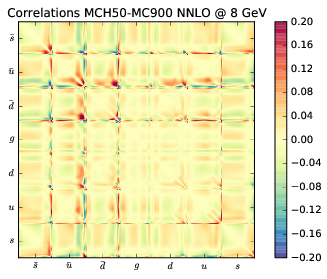
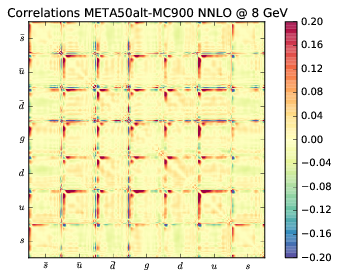
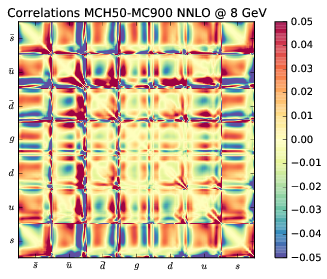
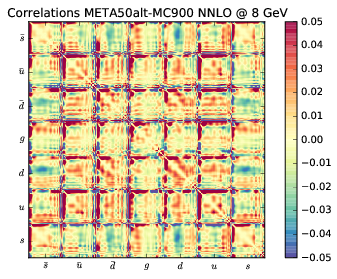
1.4.2  MC2H 50 vs Meta 50

These are all the same correlation differences, but plotted at different scales. The sampling grid is 100 logaritmically spread.
(a) MC2H [Source]
figure plots/correlations50/mchv1corr50_100.png
(b) Meta Alt [Source]
figure plots/correlations/latestmeta/meta50altcorr100.png
Figure 424 Correlation differences between prior at 100% max scale
(a) MC2H [Source]
figure plots/correlations50/mchv1corr50_20.png
(b) Meta Alt [Source]
figure plots/correlations/latestmeta/meta50altcorr20.png
Figure 425 Correlation differences between prior at 20% max scale
(a) MC2H [Source]
figure plots/correlations50/mchv1corr50_5.png
(b) Meta Alt [Source]
figure plots/correlations/latestmeta/meta50altcorr5.png
Figure 426 Correlation differences between prior at 5% max scale
 Subsubsection 1.4.1: MC2H 30 vs Meta 30 Up Subsection 1.4: Correlations Subsubsection 1.4.3: MC2H 100 vs Meta 100