The aim of this work is to use our knowledge of the QE and DIS cross sections and our ability to select QE and DIS events with a good efficiency to estimate the neutrino flux as a function of energy. One method to do this is as follows:
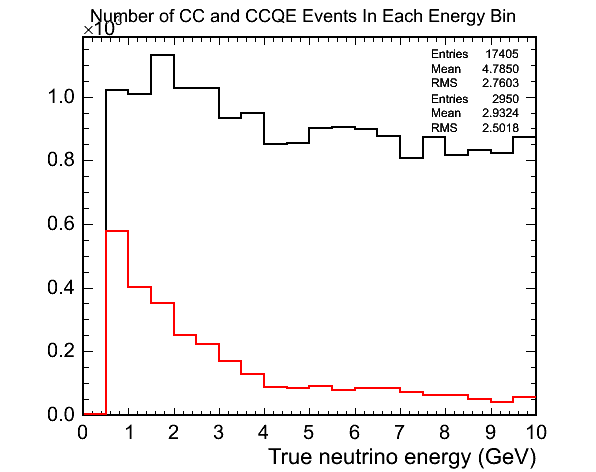
I first wanted to see what sort of a QE sample I could get for neutrino energies up to 20GeV. I have used some MC generated by Mike that has a flat energy spectrum. The following plot shows the number of true CC and true CCQE events in bins of 0.5GeV:
I then searched for some variables with QE discriminating abilities. An obvious one is the reconstructed invariant mass squared and the next plot shows this for 4 different ranges of reconstructed neutrino energy:
(black=QE,blue=RES,red=DIS)
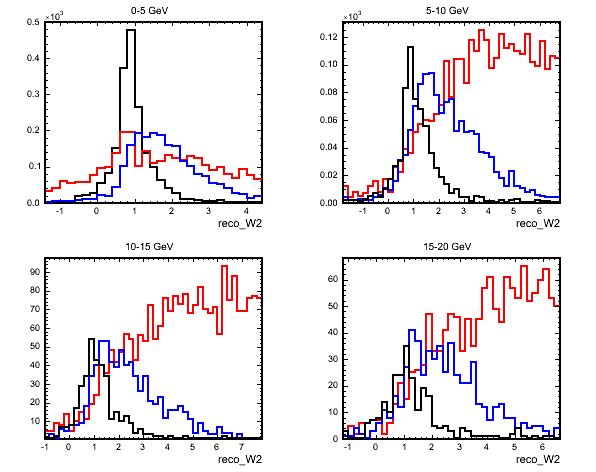
The relatively narrow peak of QE events around the mass of the proton squared allows a lot of background rejection. Other useful background rejecting variables are the numbers of showers and tracks in an event. An event with no showers is most likely QE and the number of tracks is useful as most QE events will have only one track reconstructed.
I then wanted to remove the main track from an event and look at some variables that used the remaining hits. I use the NtpSRTrack object to identify the track hits and remove these from further consideration. Where a hit is shared between the track and a shower I keep the hit but subtract 1 MIP from its PH. I also remove any hits that are further than 2m away in z from the event vertex as protons/pions should not travel further than this in the detectors. In a further effort to remove 'crosstalk-like' hits I also disregard any hits with a PH of less than 1.5pes.
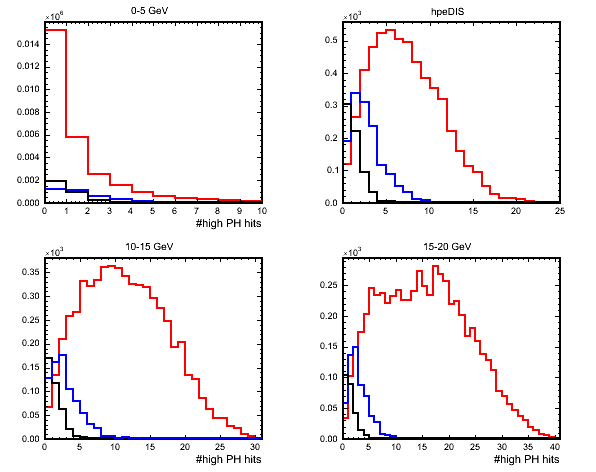
I then construct some variables with the remaining hits for each event. The next plot shows the number of >20pe hits remaining. The 'number of high PH hits' variable tries to use the fact that RES and DIS events will have more particles produced at the vertex (pion+proton/pions respectively) than QE (where there should just be the proton). Also protons will tend to leave just a couple of high PH hits whereas pions will range out a bit further into the detector leaving more high PH hits.
(black=QE,blue=RES,red=DIS)
The total PH remaining after the hit removal steps is also useful as a discrminating variable and is plotted next. For QE events where the majority of the event PH is on the track this variable is low and gets progressively higher for RES and then DIS events.
(black=QE,blue=RES,red=DIS)

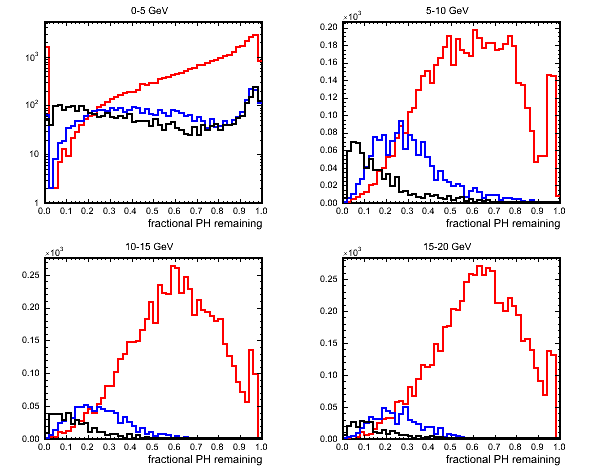
If there is NC contamination present in the sample then this will also have low PH remaining after track removal as with a NC event we only see a small fraction of the initial neutrino energy. The following variable takes care of this by taking the fraction of PH remaining to total PH in the event before any hit removal steps. QE events would be expected to have low values as most of the event PH is on the track with RES, DIS and NC higher.
(black=QE,blue=RES,red=DIS)
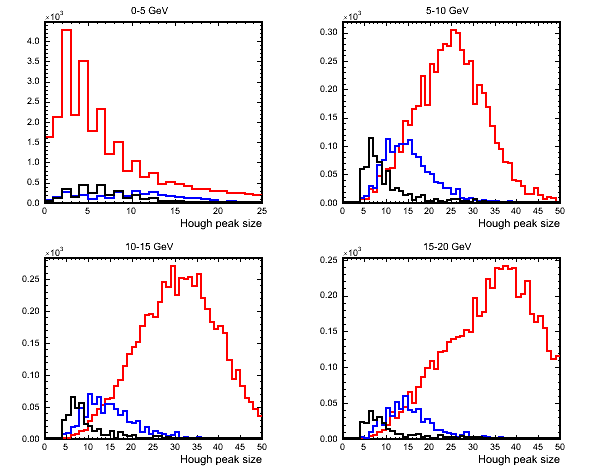
The final discriminating variable that I have considered is obtained by performing a Hough transform over the remaining hits. At first I had hoped to be able to spot the stubby proton track from QE events but this is very hard to do. The next plot shows the size of the peak in Hough space for the 4 different energy ranges for QE,RES and DIS events. This variable is in some sense a measure of the length of a track found (if there is one) which should be smaller for QE events (proton) than for RES and DIS (pions).
(black=QE,blue=RES,red=DIS)
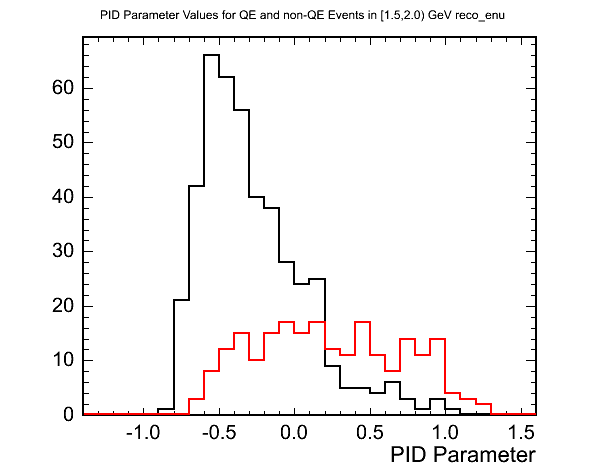
I decided to create a QE PID parameter using a maximum likelihood analysis based on these variables. At first I used all the variable distributions as one dimensional pdfs for the ML analysis but then decided to take a closer look at the correlations between my variables (and then to combine any highly correlated variables into two dimensional pdfs). I have combined the total remaining PH after the hit removal with the number of high PH hits remaining. I plan next to just use some linear combination of these two variables as a 1D pdf.
All variables will scale with energy with some functional form and so I also decided to perform a separate ML based PID analysis in asymmetric bins of reconstructed neutrino energy. A rather big caveat to the following results section is that I have used the same event set to construct the pdfs as went through the analysis and so have introduced some correlations. I did this because at the moment I don't have enough events to fill the pdfs otherwise. As such, the results shown will get worse when done properly. The PID parameter was constructed according to:
The following plot shows an example of the PID parameter for true QE and non-QE events in the [1.5,2.0) GeV reconstructed neutrino energy range.
(black=QE,red=non-QE)
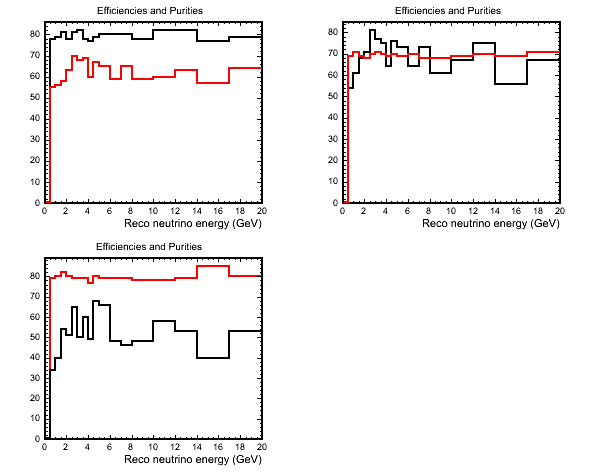
The following plot shows efficiencies and purities for some different samples. In the top left plot I have tried to flatten the efficiency of QE selection at ~80% to see what purities I can get. The top right and bottom left plots show samples for which I have tuned the PID cuts to give QE samples with purities of 70% and 80% respectively.
(black=efficiency, red=purity)
My immediate next tasks are:
The method from here is to construct estimators for the numbers of true QE events in each bin according to:
The high E estimator(s) can then be used, as described in the overview section, to normalize the QE cross section at relatively high energies. The cross section can then be 'divided out' from the remaining estimators to give a measurement of the neutrino flux in each of the bins of reconstructed neutrino energy.