
As an exercise in understanding the complexities of the ND sts calibration I have been writing some code to generate my own calibration constants and have been comparing these values with those in MC. So far I have encorporated:
I shall describe the methodology I am employing for each of these steps and show some results.
My event pre-selection is as follows:
I have yet to encorporate any cuts on the hits themselves and will include in the near future:
I then fill histograms for each strip with the SigLin values for any muon track hits that occur on that strip. I also make histograms that have these SigLin distributions truncated at 80% of the maximum value.
I take the means of the regular and truncated histograms and use them to construct 2 sets of calibration constants. Firstly the values are corrected for attenuation using the Calibrator GetAttenCorrectedTpos() function that takes as arguements; the strip end ID, the hit 'lpos' and the SigLin value. The lpos value is obtained by using the 'trk.stpu' value if the hit occurs in a V plane and the 'trk.stpv' value if the hit occurs in a U plane.
These attenuation corrected values are then scaled by a path length correction that I calculate in the following way:
I then use the mean of these corrected means to define the value to which all strips will be calibrated.
The following figure shows the effect of the event pre-selection on the SigLin means distribution for:
where the calorimeter is defined as planes up to and including 120, the black histograms are the SigLin mean distributions before any event pre-selection and the red histograms after:
Figure 1.
It can be seen that the basic event pre-selection is having very little effect. This is because all the hits used, even before selection, lay on the longest track in an event and these tracks often pass all the selection criteria.
The attenuation correction comes from mapper data via the Calibrator. I am correcting for the attenuation before I correct for the muon path length through scintillator - I think this is the right way around as it is the non-path length corrected signal that gets attenuated along the fibre in reality. The following plot shows the SigLin response for all the hits in my sample as a function of distance from the strip centre and then the corrected SigLin values as a function of distance from the strip centre:
Figure 2.
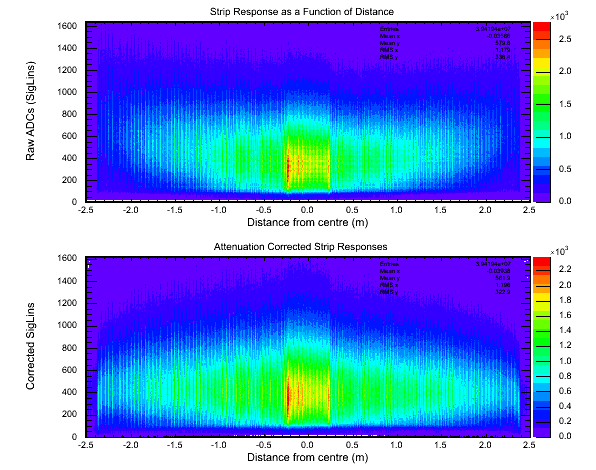
This is just a pictorial representation of the correction as it exists in the MC.
The following plot shows a histogram of the path lengths through the scintillator for all of the hits in my sample:
Figure 3.
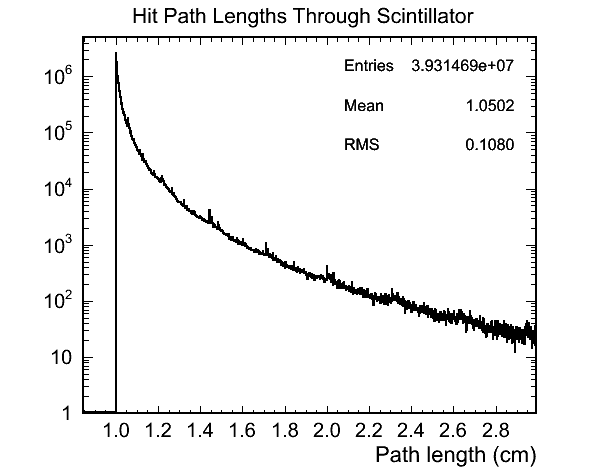
This looks as I would expect considering that I am using beam MC where most of the muons will be travelling close to parallel with the z axis. The following plot shows the SigLin response as a function of path length for all of my hits and then the path length corrected values:
Figure 4.
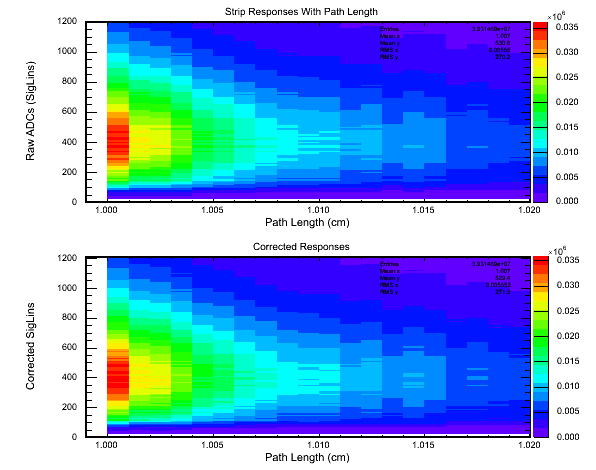
It is hard to see whether my basic path length correction is doing anything but the plot does show that either way the beam MC is such that the path length correction becomes less important than when using cosmics.
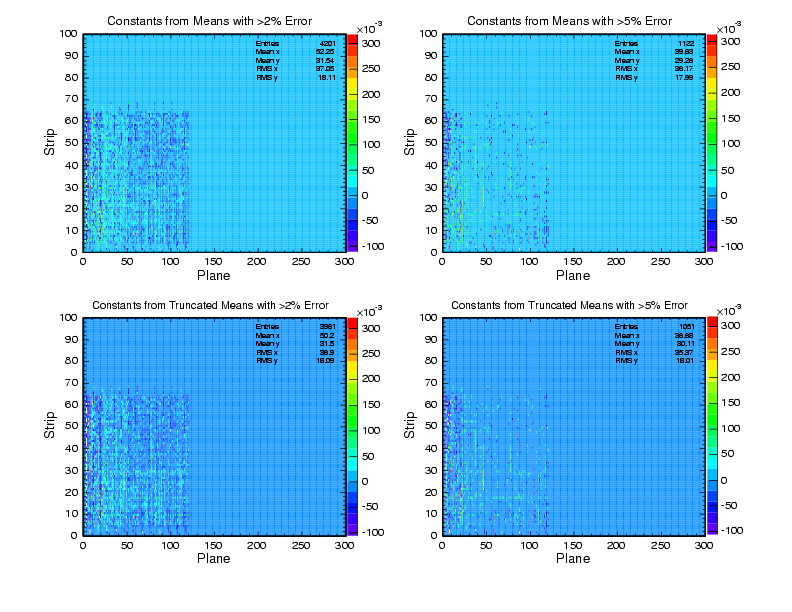
Having gone through these steps I then produce a set of calibration constants and compare these strip-by-strip with the MC values. The following plots show the errors on my produced constants for a given subset of the corrections for the whole ND and just for the calorimeter:
Figure 5.
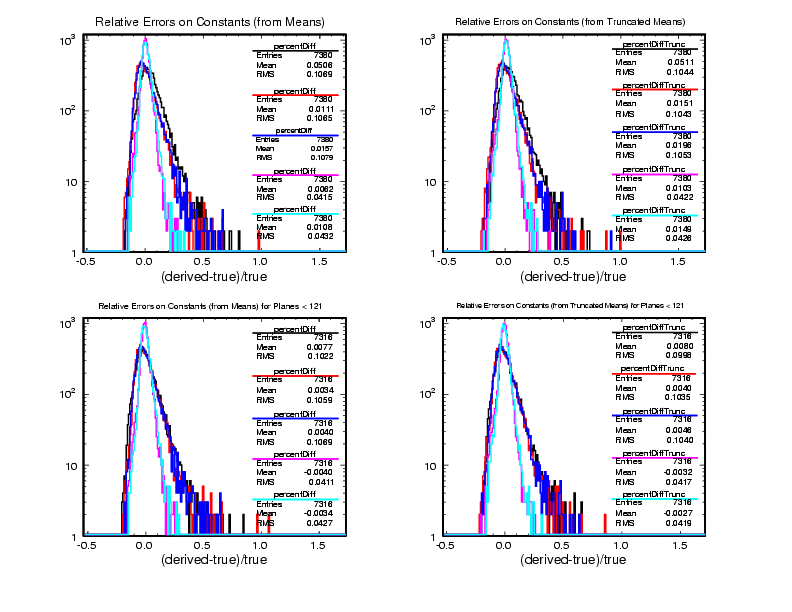
The following tables give some of the statistics for the above plots:
| Cuts Applied | Mean of Errors | RMS of Errors | Percentage of Constants at Least 2% Wrong | Percentage of Constants at Least 5% Wrong |
|---|---|---|---|---|
| No Cuts/corrections | 0.0506 | 0.1069 | 49.7 | 33.0 |
| Pre-Selection | 0.0111 | 0.1065 | 50.3 | 30.7 |
| Pre-Selection+Path Length | 0.0157 | 0.1079 | 49.2 | 29.2 |
| Pre-Selection+Attenuation | 0.0062 | 0.0415 | 31.1 | 9.2 |
| All cuts/corrections | 0.0108 | 0.0432 | 33.6 | 10.1 |
| Cuts Applied | Mean of Errors | RMS of Errors | Percentage of Constants at Least 2% Wrong | Percentage of Constants at Least 5% Wrong |
|---|---|---|---|---|
| No Cuts/corrections | 0.0077 | 0.1022 | 68.5 | 43.6 |
| Pre-Selection | 0.0034 | 0.1059 | 69.5 | 43.6 |
| Pre-Selection+Path Length | 0.0040 | 0.1069 | 68.9 | 42.9 |
| Pre-Selection+Attenuation | -0.0040 | 0.0411 | 44.7 | 12.3 |
| All cuts/corrections | -0.0034 | 0.0427 | 49.7 | 13.3 |
I have not tabulated the results for the constants derived from the truncated mean distributions but they are very close to the values given here using the means. It can be seen that the only correction that is really doing any work here is the attenuation correction. I plan to refine my basic pre-selection and path length corrrections as they are fairly preliminary at the moment.
The means when I consider the whole ND are systematically different from 0.0 and this is because in the MC the 'average response per strip' value from which the constants are derived is made considering only the calorimeter planes with the spectrometer planes all having a constant of 1. This problem hence goes away somewhat when I only consider the calorimeter planes.
The following plane v.s. strip maps show where the problem strips are when all cuts have been applied:
Figure 6.
I have a much better understanding of the strip-to-strip calibration and have had a go at incorporating some of the necessary corrections to a MC sample of events. My derived constants have then been checked against the MC values and the differences shown. I am planning next to: