

![]()
![]()
![]()
![]()
![]()
![]()
![]()
![]()
![]()
![]()
![]()
![]()
![]()
![]()
![]()
Duration of test against throughput
Tests were conducted on 20th June 2002.
Test machines were 193.60.157.104 (source) and pcgiga.cern.ch (sink).
rtt is approximately 19ms, with little deviation and absolute minimum
rtt of about 12ms - although infrequent. Given a max link capacity of
about 622mbits/sec, bandwidth delay product should be about 622*1000000*19*0.001/8
bytes = 1443 kbytes socket buffer.
Test methodology was to run a series of iperf tests between the two machines for varying amounts of time with different socket buffer sizes. This is to determine the optimal test duration for such a route.
Scripts used for test:
do_time.pl - command line to perform a set tests with various socket buffer sizes.
cook.pl - script to poll through a series of files and present iperf data in tabular format.
using iperf version 1.2 (2nd April2001), pthreads at Man
using iperf version 1.2-Beta (2nd April 2001), pthreads at CERN (although i have suspicion that this isn't actually a beta)
Initial results
log directory here.
between 12:00 pm and 13:00 pm on 20th June 2002.
|
20020620-12:10:54-20020620-12:12:38
|
20020620-12:14:03-20020620-12:15:46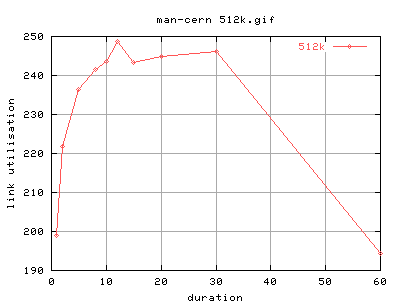 |
|
20020620-12:17:03-20020620-12:18:47
|
20020620-12:20:37-20020620-12:22:22
|
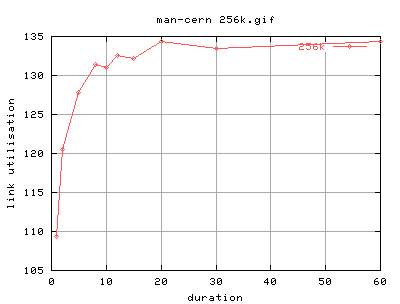
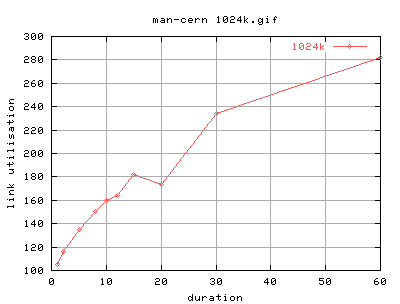
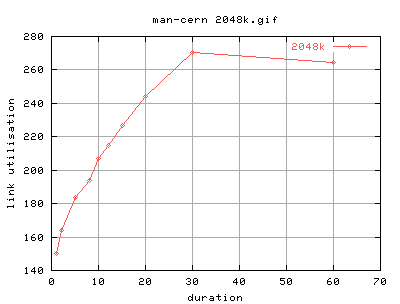
Need to fill out more values between 20 and 60.
Suggest that lower socket buffer sizes need less time to get to optimal.
Test run 2
Tests conducted with finer transfer durations past 1600pm on 20th June 2002.
log directory here.
|
20020620-164030-20020620-164709
|
20020620-162959-20020620-163637 |
|
20020620-161826-20020620-162505
|
20020620-160823-20020620-161502
|
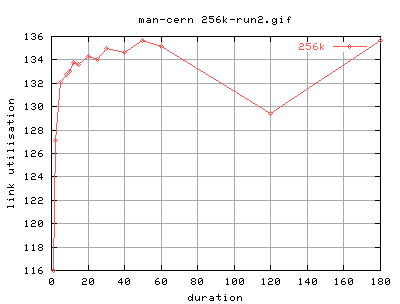
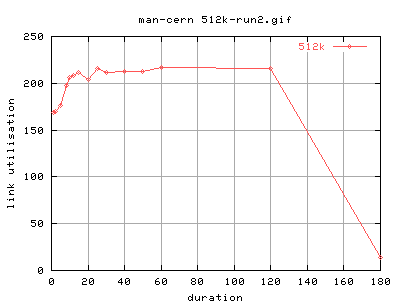
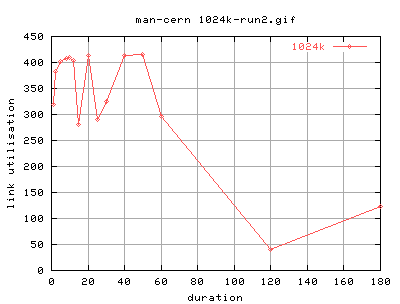
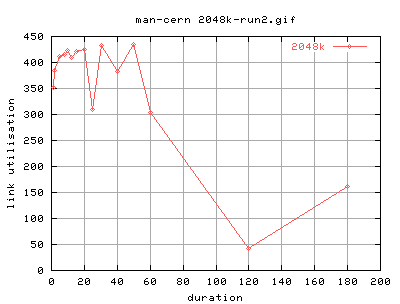
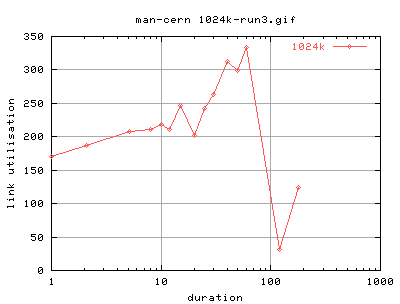
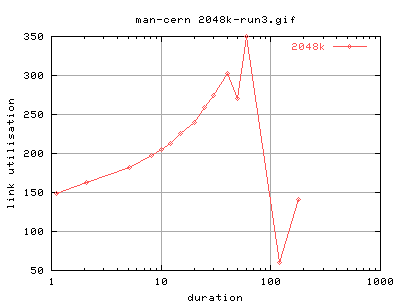
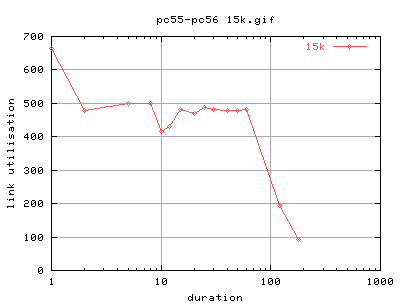
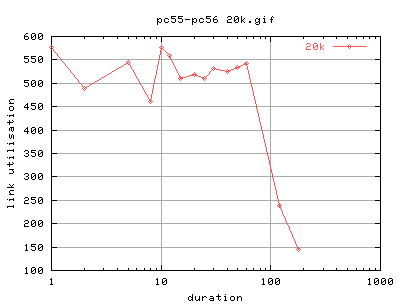
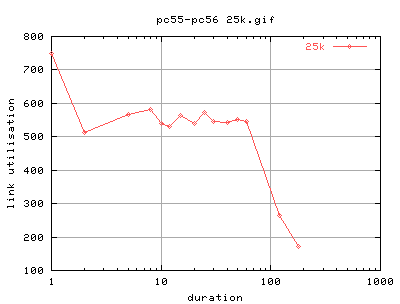
Lot of variation between points - most likely due to cross traffic.
However, for larger buffer sizes, throughput changes dramatically past 60 seconds. Are they limiting the transfer in some way?
Might be easier to see things on log x graph instead.
Might want to test on back to back also to check whether its not CERN capping transfers. ie where does iperf store its recieved data? if its ini memory, then it might need to cache it on a swap file instead - leading to bottleneck at hard disk instead of the network.
|
20020620-165357-20020620-170042
|
20020620-170412-20020620-171052
|
Hmm.. at least the log graphs are more informative! :)
Err.. it does appear that transfers over 60 seconds really mess up in terms of transfer. The way they do for the two buffer sizes implies that there's something inherient in the test. Also, we're getting less throughput than for run2. More traffic? Would explain why its slightly smoother.
21-06-2002: The fact that there is a gradual increase in the throughput with increasing durations - ie it doesn't plateau means that the optimal time in which to conduct a iperf test is undetermined. Rubbish innit?
Okay, lets try some back to back tests then. Local LAN. Won't have the effects of the WAN (cross traffic, high rtt) but it will at least give some demonstration of whether it's iperf or whatever. rtt is about 150nanoseconds = 0.15ms = 1.5e-4Bandwidth delay for this would give a socket buffer size of about 1e9*1.5e-4 = 1.5e5 bits = 1.5e5/(8*1024) bytes = 18.3kbytes.
so, i'm gonna do socket buffers of {5, 10, 15, 20, 25}kbytes
Note that the pcs are connected with a normal cat5 cable rather than a cat5e cable. May cause interference and reduction in performance as result.
LAN results
|
20020620-162923-20020620-163601
|
20020620-164200-20020620-164838
|
|
20020620-165334-20020620-170013
|
20020620-170522-20020620-171200
|
|
20020620-171604-20020620-172242
|
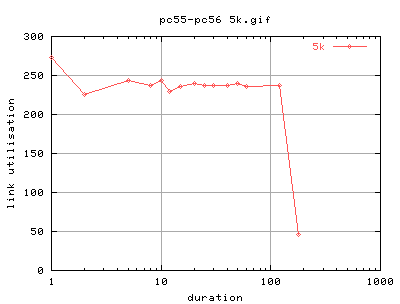
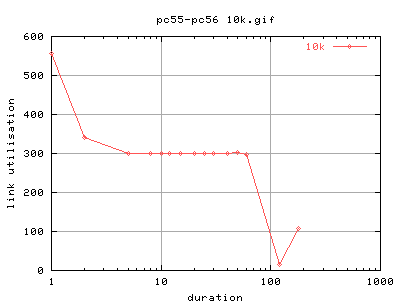
21-06-2002: At least these give some indication of a good transfer time for iperf tests, i would say about 8seconds is okay. Although you have to consider that the rtt is only 0.15 ms. A good way to determine the transfer times would be to have a plot of rtt and plateau value.
The initial start up period of about 2 seconds can be attributed to the slow start period shoving lots of data through, hence giving a lot of throughput. As we increase the time, congestion avoidance has a chance to shove its head in, causing a less throughput over the duration of the test.
Also performance of the 3com BroadCOM cards aren't that good. I only seem to be able to get about 550mbits/sec from them. The changes in throughput could be associated with cpu activity. Tests are required to confirm this. But it can also be because of the standard cat5 cable between the machines.
These tests seem to show that the funny results shown on the WAN tests is also in the LAN tests. On all experiments, after about 60 seconds, there is a sudden decline in the performance of the iperf throughput. :( What's happening? dunno, i would guess at the moment that is is because the iperf server does not have enough buffer to hold all the data it's recieveing. Surely this is bad programming as it should just discard it? it's not as though it's useful data stored in the packets.
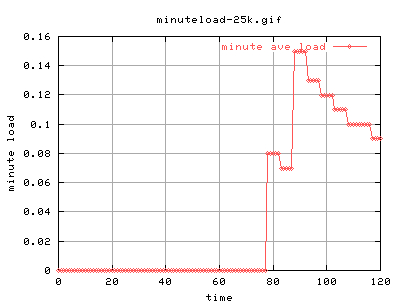
So lets monitor the cpu and memory levels on the recieving machine for a high socket buffer size (25kb) for each duration.
CPU load and Memory Usage
Conducted about half 6pm 20th June 2002.
First test is one of a 60 second transfer, i've started monitoring the cpu and memory loads 30 seconds before the transfer fo the iperf test.
Log of transfer here.
 |
 |
 |
------------------------------------------------------------ Client connecting to 192.168.0.56, TCP port 5001 TCP window size: 51200 Byte (WARNING: requested 25600 Byte) ------------------------------------------------------------ [ 3] local 192.168.0.55 port 58540 connected with 192.168.0.56 port 5001 [ ID] Interval Transfer Bandwidth [ 3] 0.0-60.0 sec 4161880064 Bytes 554910960 bits/sec |
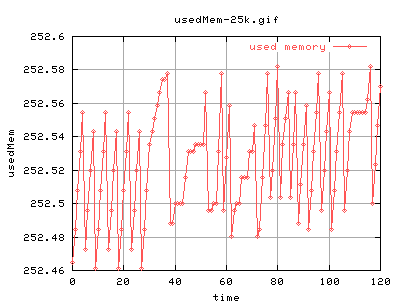
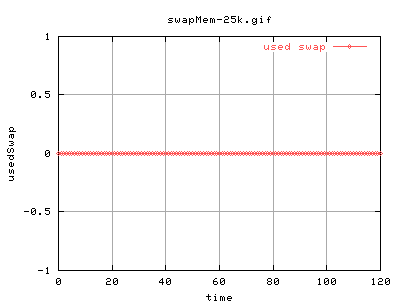
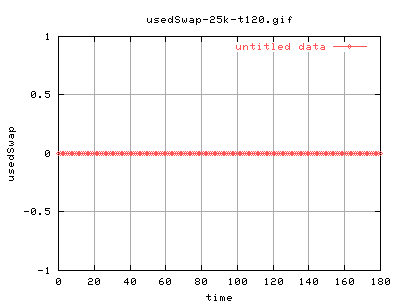
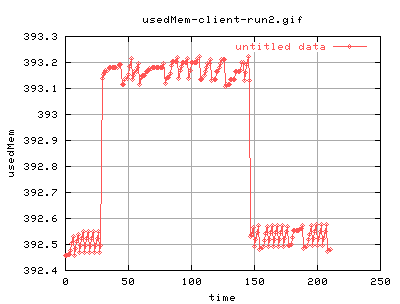
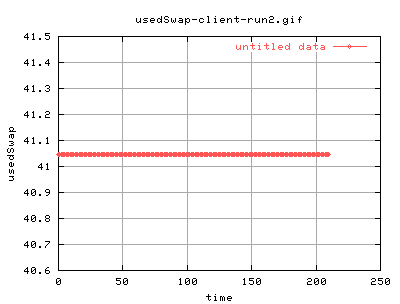
Can't tell much unfortunately. The load averages aren't much use, will probably have to monitor for over a minute after the tranfer and extrapolate backwards :( Does any know of monitoring the instantaneous cpu load? (or at least to a higher precision). Memory wise, There is a change at 30 seconds - but the increase isn't much - at all. And there isn't a large change in the memory use after either. :( The swap graph shows absolutely no change in the swap usage either :(. Oh well. I should try transfering for a longer period really - shouldn't i? hehe..
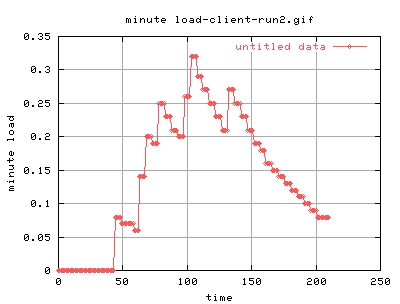
Okay, these are for 120 second iperf test. Maybe we'll see something after 60 seconds into the transfer.
Duh! i've set the duration of the cpu monitoring for only 30 secs after the end of the transfer... gawd, i think i need to go home soon!
Log of transfer here.
 |
 |
 |
------------------------------------------------------------ Client connecting to 192.168.0.56, TCP port 5001 TCP window size: 51200 Byte (WARNING: requested 25600 Byte) ------------------------------------------------------------ [ 3] local 192.168.0.55 port 59062 connected with 192.168.0.56 port 5001 [ ID] Interval Transfer Bandwidth [ 3] 0.0-120.0 sec 3863216128 Bytes 257546514 bits/sec |
Nope, same :( Can i explain the decrease?.... at least the transfer rate is smaller...
21st June 2002
Lets try it out at the sender instead
 |
 |
 |
------------------------------------------------------------ Client connecting to 192.168.0.56, TCP port 5001 TCP window size: 51200 Byte (WARNING: requested 25600 Byte) ------------------------------------------------------------ [ 3] local 192.168.0.55 port 41127 connected with 192.168.0.56 port 5001 [ ID] Interval Transfer Bandwidth [ 3] 0.0-120.0 sec 3921248256 Bytes 261414620 bits/sec |
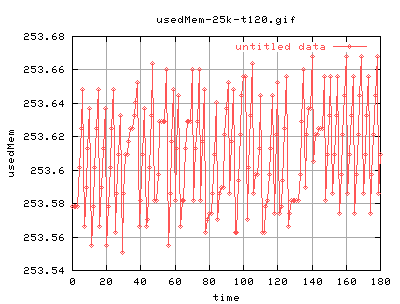
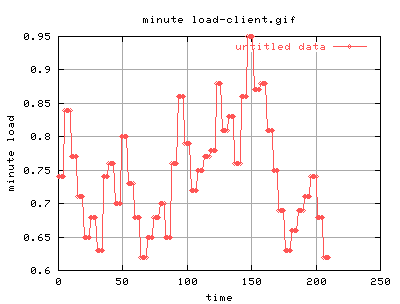
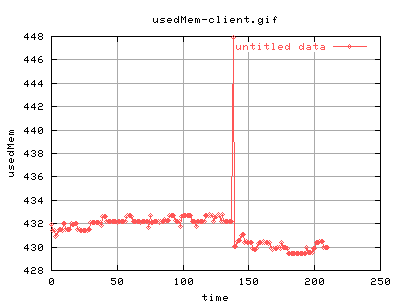
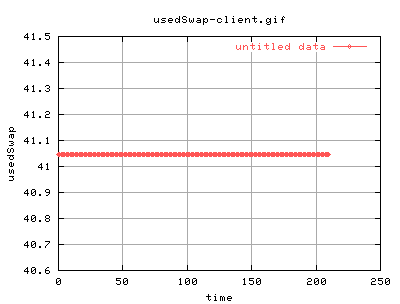
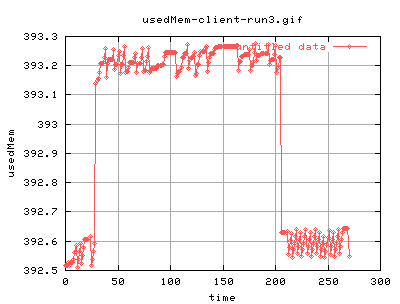
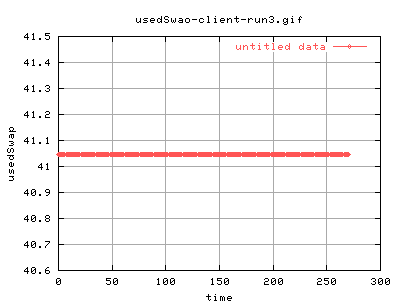
There is s big hitch in the used memory at about 130 secs - could it be this? The swap useage seems to be constant tho'.
I think this needs be be run again! - just to make sure that spike is actually cuased by iperf and not one of my other programs running.
Might be a good idea also to monitor with the Web100 stuff.
 |
 |
 |
------------------------------------------------------------ Client connecting to 192.168.0.56, TCP port 5001 TCP window size: 51200 Byte (WARNING: requested 25600 Byte) ------------------------------------------------------------ [ 3] local 192.168.0.55 port 41495 connected with 192.168.0.56 port 5001 [ ID] Interval Transfer Bandwidth [ 3] 0.0-120.0 sec 3925311488 Bytes 261686019 bits/sec |
Hmm.. at least we can see that iperf does take up memory - although it's only less than a meg...
Lets try it for a longer duration, say 180 seconds. Opps, pressed it a second too early, but it shouldn't matter really.
 |
 |
 |
------------------------------------------------------------ Client connecting to 192.168.0.56, TCP port 5001 TCP window size: 51200 Byte (WARNING: requested 25600 Byte) ------------------------------------------------------------ [ 3] local 192.168.0.55 port 41496 connected with 192.168.0.56 port 5001 [ ID] Interval Transfer Bandwidth [ 3] 0.0-180.0 sec 3862937600 Bytes 171685192 bits/sec |
Doesn't say anything does it? Oh well, lets try to explain this using web100 stuff then...
it should really go on a separate page, so here it is.
| Mon, 8 July, 2002 21:52 |
Room D14, High Energy Particle Physics, Dept. of Physics & Astronomy, UCL, Gower St, London, WC1E 6BT