

![]()
![]()
![]()
![]()
![]()
![]()
![]()
![]()
![]()
![]()
![]()
![]()
![]()
![]()
![]()
Monitoring iperf using web100
So lets recap:
transfers (both lan and wan) using iperf 1.2 (April 2001) seem to give a really poor performance after about 60seconds. Explain....
Setup
Scripts used: Note that do_time.pl was modified to handle logvars monitoring.
do_time.pl, graph.pl, logvars (1.0.2)
Interesting results will be the evolution of cwnd, the number of slowstarts, and as a general overview the number of packets and databytes out of the system.
All tests unless otherwise stated are between pc55 topc56. with 8m receiver buffer and 25k send buffer.
Run4
transferring iperf for 180 seconds between pc55 and pc56 via gigE seems to generate a web100 log file that was just a little too big - 12mb worth! My little graphing program can't handle that many points, and nor could Excel, so i'm gonna lower the logvars resolution from 10ms to 100ms. This should only create a 1mb file then...
Anyway, for those who are interested, heres the log file!
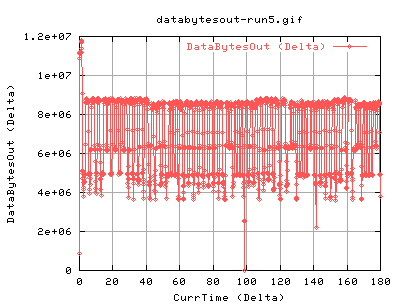
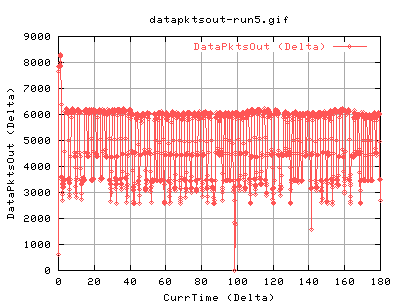
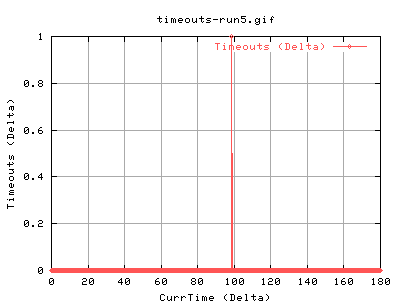
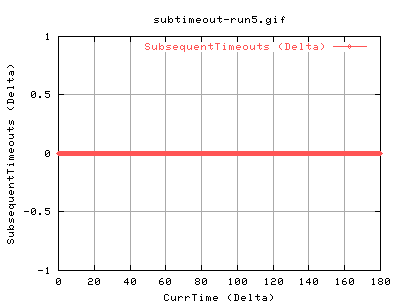
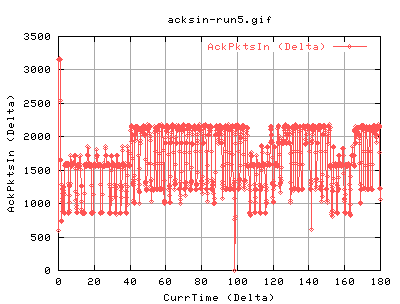
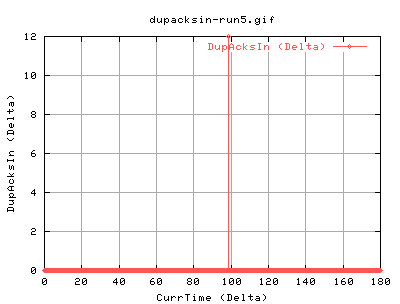
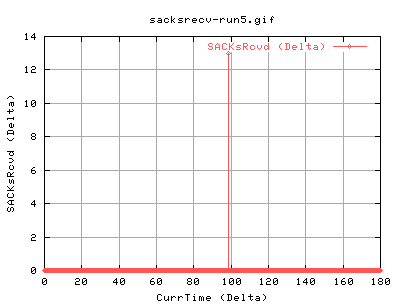
Run5
Same again, but with a 100ms frequency of web100 traps. (hopefully i'd be able to plot it!)
------------------------------------------------------------
Client connecting to 192.168.0.56, TCP port 5001
TCP window size: 51200 Byte (WARNING: requested 25600 Byte)
------------------------------------------------------------
[ 3] local 192.168.0.55 port 41521 connected with 192.168.0.56 port 5001
[ ID] Interval Transfer Bandwidth
[ 3] 0.0-180.0 sec 3863527424 Bytes 171711533 bits/sec
  |
|
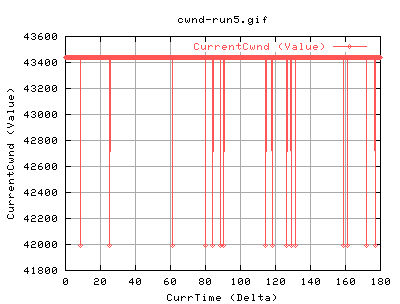 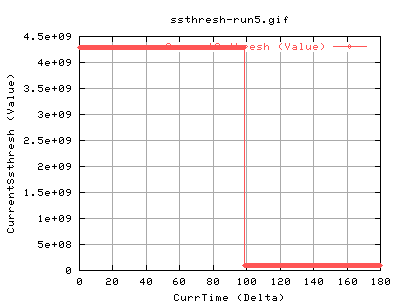 |
The high value of ssthresh initially is always like this - its built into the kernel. The change at just before 100secs is due to congestion events halving the ssthresh to half of the cwnd each time.
Right, these show the transfer against time. The dip just before 100 seconds imply something happened. As the ssthresh fell, it is possible that this was due to a congestion event. However, the databytes out and pkts doesn't really change much after it. This is mostly due to the fact that currentssthresh determines when to go back into congestion avoidance.
Lets look at timeouts
 |
|
 |
 |
We can see that the timeout was caused by the complete lack of ack packets coming in. This forces tcp to retransmit the 13 pkts. These also have the effect of changing the SACK status:
 |
|
 |
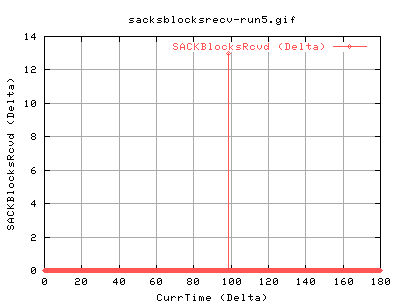 |
As we can see the recv is sending ACKs back to us saying that it hasn't recieved a certain packet.
However, the question still remains as to the cause of this timeout. It's loss, of course, but from where? Just to see whether this was a one off anonoly, we do the test again.
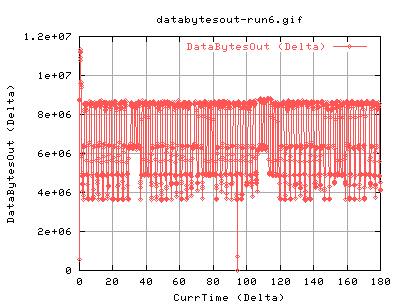
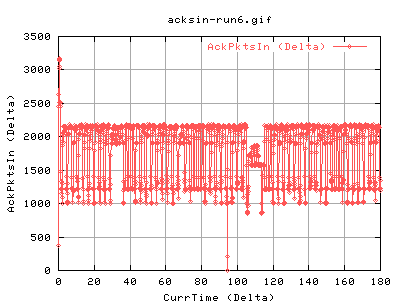
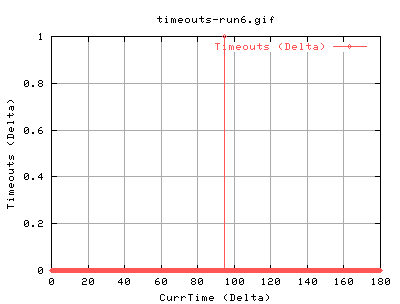
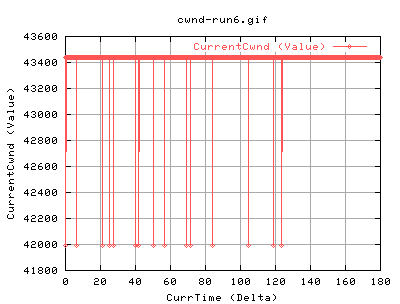
Run6
So here's the same thing again:
------------------------------------------------------------
Client connecting to 192.168.0.56, TCP port 5001
TCP window size: 51200 Byte (WARNING: requested 25600 Byte)
------------------------------------------------------------
[ 3] local 192.168.0.55 port 41523 connected with 192.168.0.56 port 5001
[ ID] Interval Transfer Bandwidth
[ 3] 0.0-180.0 sec 3652960256 Bytes 162352864 bits/sec
 |
 |
 |
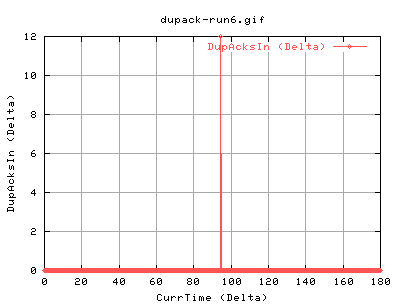 |
Yep, same thing again - although this time, it happened a bit earlier... :( Maybe its the amount of data transfered?
 |
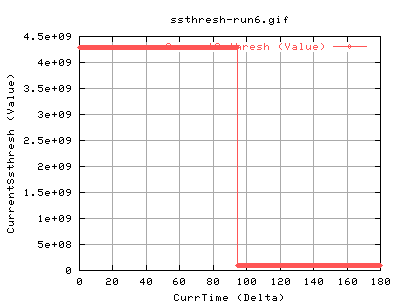 |
Same again, just earlier.
Okay, lets' see how much data is transferred.
Well, according to DataBytesOut_(Value), at the point just before the timeout, the total mbytes send was 6103.2 - or 5.96gbytes of data. For run5, 6492.87Mbytes or 6.34Gbytes.
How about number of packets?
run5: 4801201 of which were datapkts 4801199 number of acks in: 1614444
run6: 4513524 of which were datapkts 4513522 number of acks in: 1688930
Hmm.. can't really say anything here:(
However, it is a way of indicating loss: it's approximately 13 in 4,500,000
or 3e-5, which is actually quite high! although one can seriously question
why we get them all at once!
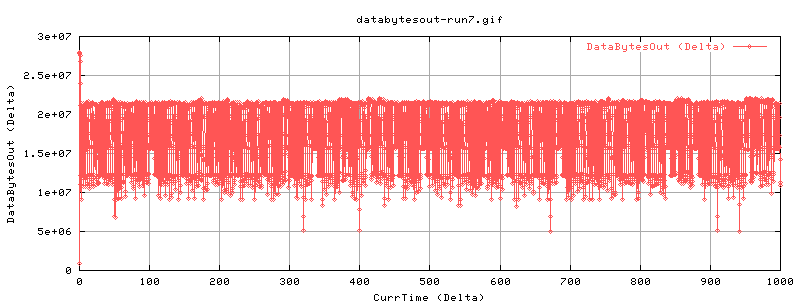
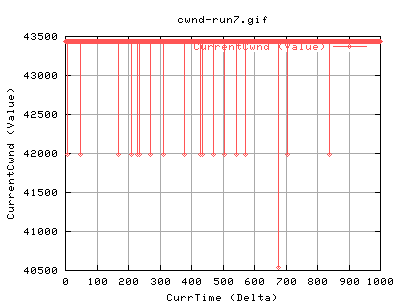
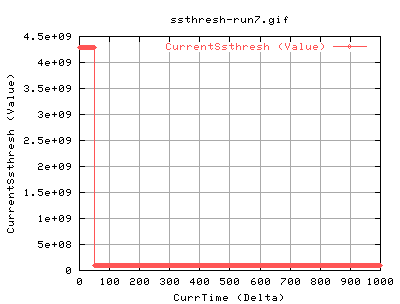
Run7
We should see whether this is periodic or not. As such, run7 is done with a 1000sec test, and an web100 trap rate of 250ms.
------------------------------------------------------------
Client connecting to 192.168.0.56, TCP port 5001
TCP window size: 51200 Byte (WARNING: requested 25600 Byte)
------------------------------------------------------------
[ 3] local 192.168.0.55 port 41526 connected with 192.168.0.56 port 5001
[ ID] Interval Transfer Bandwidth
[ 3] 0.0-1000.0 sec 4031684608 Bytes 32253456 bits/sec
 |
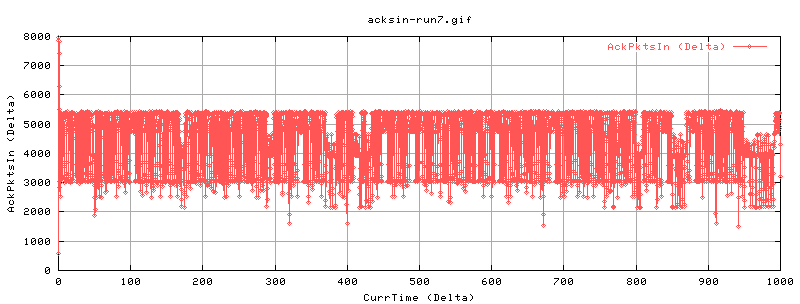 |
The drops are less pronounced, mainly because of the higher trap rate. But there are periods in which the number drops. Looking at cwnd etc.
 |
 |
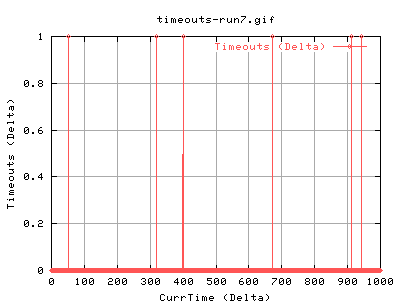 |
There's no peridocity here....
Let's look back at the iperf transfer logs:
In web100: it says that 65284.93754mbytes were transferred. So this is
65284.9/1000 sec = 65.28 mbytes a second average!! That's 522.27 mbit/sec.
Which is actually okay :)
Iperf states that it has transferred 4031684608*8/1000000 mbytes = 32253.47 mbytes! in 1000 seconds, this is 32.25 mbits/sec ... something is fishy here.... which is the same as the final figure on it - 32253456/1024/1024 mbits/sec = 32.25 mbits/sec.
Thought this was a bit strange as the databytesout didn't change... should have calculated that! oh well.
So web100/tcp says that we are actually sending out the right amount of stuff... BUT iperf seems to be lying... probably because it's using floats instead of double for example.
I suppose the next thing to do as a result from this is to find out what the maximum amount of data trasfer is before the counter is wrong... i should also investigate into the 1.6 version to see whether it has the same bug.
From the graphs of the previous lan tests, one can see that with an average of about 550mbits/sec, its okay upto 60 seconds, so it start messing up about 33,000 mbits, ie 4.1Gbytes. Also, for small windows, 240mbitsx120sec = 28,800 = 3.5Gbytes. Using the iperf -n option to transfer a set number of bytes, i'll choose {1.5gb, 2gb, 2.5gb, 3gb, 3.5gb, 4gb, 4.5gb, 5gb, 5.5gb}, again with the 25k window.
These should take about (assume 550mbits/sec = 68mbytes/sec) {23,30,38,45,53,60,68,75,83}
Run8
In order to do this, we must write a new script - so i'm gonna hack do_time.pl to do_bytes.pl.
whilst i wait for the results, if a variable has type float of 32bits, then it can only hold 4,294,967,296 values (if unsigned). This is only 4gb if we convert to bytes, ie 4096. So the chances are that once we send more than 4gb of data, the values are overwritten hence making a mess of the values
| date | duration | bytes_transferred | link_utilisation |
| 20020621-161307 | 23.4 | 1536 | 549.649718 |
| 20020621-161331 | 32 | 2048 | 536.632882 |
| 20020621-161404 | 39.3 | 2560 | 546.153417 |
| 20020621-161445 | 47.9 | 3072 | 538.135913 |
| 20020621-161534 | 56 | 3584 | 537.306476 |
| 20020621-161631 | 0 | 0.0078125 | 57.893993 |
| 20020621-161632 | 7.3 | 512 | 591.900411 |
| 20020621-161640 | 16.5 | 1024 | 521.223458 |
| 20020621-161657 | 23.2 | 1536 | 554.558271 |
As you can see, the 4gb transfer has duration 0! the the link_utilisation is very small (probably as a consequence), and then the time difference expected for each 0.5gb is used as the duration instead. Also the bytes_transferredfor the values >4gb are wrong, instead its the amount greater than the value of 4gb that is recorded. Strangely tho, the link_utilisations for these are correct (or at least look okay). And it's not a result of the bytes_transferred/duration as they would give {561.1,496.5,529.7}mbits/sec. So the chances are the values are the real averages of the entire transfer.
Hmm... okay, so why the strange fall when transfers are greater than 60 seconds? I would have guessed that it's related to this 4gb thing.
Due to a problem with my logging of web100, i had to redo the tests of 4096 and greater.
| Transferred | web100 | iperf | ||||
| mbytes | mbits | transferred | duration | rate | duration | rate |
| 1536 | 12288 | 12288 | 23.498786 | 522.9206309 | 23.4 | 549.649718 |
| 2048 | 16384 | 16384.14362 | 32.24839 | 508.0608246 | 32 | 536.632882 |
| 2560 | 20480 | 20480 | 39.499432 | 518.4884684 | 39.3 | 546.153417 |
| 3072 | 24576 | 24576.13257 | 47.999167 | 512.0116474 | 47.9 | 538.135913 |
| 3584 | 28672 | 28672.15466 | 55.999206 | 512.0100214 | 56 | 537.306476 |
| 4096 | 32768 | - | 0 | - | 0 | 85.222367 |
| 4608 | 36864 | 4096 | 7.999324 | 512.0432677 | 8 | 539.971224 |
| 5120 | 40960 | 8192 | 14.999344 | 546.1572186 | 15 | 572.684374 |
| 5632 | 45056 | 12288 | 23.999424 | 512.0122883 | 24 | 537.166219 |
This table shows that differences in what the tcp is detecting and what iperf is giving. As you can see, the rates are different (yep, i've checked the cooked files), with iperf overestimating what web100 states. Checking the math, for the first one 12288/23.4 = 525.13mbits/sec - which is much closer to that reported by web100 than iperf. Similarly for the rest of them!
Iperf can't do math!!
For the other bits, ie files larger than 4gb, according to web100, it doesn't actually transfer more than 4gbs. This is shown in the web100 traces of >=4gb which show that only the difference is transferred (haven't i already said that!?). And this is confirmed for the duration of the tests.
So to summarise, iperf wraps transfers to multiples of 4gb. It then only transfers the remainder of the value.
However, i'm still not sure of the >60secs problem, although i would at the moment guess that this has something to do with this 4gb problem (i know windows used to have problems with this limit, but i thought it was only windows!). Looking at the plots on the previous page; 4gbytes = 32,768mbits, given that the transfer rate from man to cern is about 550mbits for large buffers, means that it would take about 60 seconds to transfer 4gb....!!
Strange thing is that SLAC transferred about 11gb with iperf! see here. and they didn't see this problem... i'm just unlikely i suppose :( Is there a kernel parameter i need to fiddle with?
One thing to consider is that with this 4gbyte limit, if we could get 1000mbits/sec out of our card, that means we can get 125mbytes/sec... so we can only transfer for 33 seconds to get sensible results from iperf.....
Other things to check are:
Whether this applies to the 1.6 release of iperf.
What actually happens when we transfer for a long time? Does it terminate
after transferring 4gb? or does it continue and only calculates the values
for the bit after the 4gb? The graphs for long transfers with web100 seem
to show that it does transfer for longer, however, the results reported
by iperf are wrong... If it just calculated the bit after, we should still
still quite high values (like the tables above), however, it doesn't.
Meaning that it most probably calculates it for the whole transfer. Because
the thing is limited by 4gb, and therefore most probably to storing 32bit
numbers as well, then it could be because its wrapping round. As this
would imply a smaller transferred value over the same time, the throughput
would be less... aha!
However, these tests were conducted with the -fb option to get the bytes and bits rather than the k/m values.
Doing a quick test without the -fb option, gives
[ytl@pc55:~/iperf]$ iperf -c 192.168.0.56 -w 25k
-t 180
------------------------------------------------------------
Client connecting to 192.168.0.56, TCP port 5001
TCP window size: 50.0 KByte (WARNING: requested 25.0 KByte)
------------------------------------------------------------
[ 3] local 192.168.0.55 port 42081 connected with 192.168.0.56 port 5001
[ ID] Interval Transfer Bandwidth
[ 3] 0.0-180.0 sec 3.4 GBytes 163 Mbits/sec
So it seems like as though iperf doesn't work for transfer longer than 4gbyte in size... :(
Lets see, 550mbits/sec for 180 is 12,375mbytes = 12.08 gbytes. iperf reports that it only transferred 3.4gb - which we know is a lie - 3.4gb = 27,853mbits. 27,8753/180 = 154.7mbits/sec... lower than the value given, but near.
So much for using it for background traffic then... hmmm....
Iperf 1.6.1
Let's try out iperf v1.6 then....
It seems like 1.6.1 is out here. installed on both pc55 and pc56...
Initial tests by setting -n 4096m FAILED!
Sending for 180seconds FAILED! (see below)
[ytl@pc55:~/iperf-1.6.1]$ ./iperf -c 192.168.0.56
-w 25k -t 180
about to getaddrinfo on '192.168.0.56'
done with gai, ai_fam=2 ai_alen=16 addr=0x00000002...
------------------------------------------------------------
Client connecting to 192.168.0.56, TCP port 5001
TCP window size: 50.0 KByte (WARNING: requested 25.0 KByte)
------------------------------------------------------------
[ 3] local 192.168.0.55 port 42263 connected with 192.168.0.56 port 5001
[ ID] Interval Transfer Bandwidth
[ 3] 0.0-180.0 sec 3.4 GBytes 160 Mbits/sec
oh well.... maybe i should report this... then again, it is a security feature i suppose... but 33 seconds... gotta check with SLAC.
Right, /proc settings - on pc55
[ytl@pc55:/proc/sys/net/ipv4]$ cat tcp_rmem
4096 87380 174760
[ytl@pc55:/proc/sys/net/ipv4]$ cat tcp_wmem
4096 16384 131072
[ytl@pc55:/proc/sys/net/core]$ cat rmem_default
65535
[ytl@pc55:/proc/sys/net/core]$ cat rmem_max
8388608
[ytl@pc55:/proc/sys/net/core]$ cat wmem_default
65535
[ytl@pc55:/proc/sys/net/core]$ cat wmem_max
8388608
and pc56
[ytl@pc56:/proc/sys/net/ipv4]$ cat tcp_rmem
4096 87380 174760
[ytl@pc56:/proc/sys/net/ipv4]$ cat tcp_wmem
4096 16384 131072
[ytl@pc56:/proc/sys/net/core]$ cat rmem_default
65535
[ytl@pc56:/proc/sys/net/core]$ cat rmem_max
8388608
[ytl@pc56:/proc/sys/net/core]$ cat wmem_default
65535
[ytl@pc56:/proc/sys/net/core]$ cat wmem_max
8388608
Mine are slightly different to the ones on the slac site - most noticeably the tcp_{r|w}mem values. They refer to "min default max" of the autotune buffers. Hmmm... am i limiting the transfer rate by having the value set in the rmem_max et al? I suppose with iperf, it's actually giving out the correct values so it's okay....
lanl suggest:
echo 6553500 > /proc/sys/net/core/wmem_max
echo 6553500 > /proc/sys/net/core/rmem_max
echo 4096 16384 6553500 > /proc/sys/net/ipv4/tcp_wmem
echo 8192 87380 6553500 > /proc/sys/net/ipv4/tcp_rmem
echo 6553500 6653500 6753500 > /proc/sys/net/ipv4/tcp_mem
But i think 64m for the max is a bit extreme, so i've toned it down to 8m on both machines..
Running iperf 1.6.1 again on this new configuration gives...
[ytl@pc55:~/iperf-1.6.1]$ ./iperf -c 192.168.0.56 -w
25k -t 180
about to getaddrinfo on '192.168.0.56'
done with gai, ai_fam=2 ai_alen=16 addr=0x00000002...
------------------------------------------------------------
Client connecting to 192.168.0.56, TCP port 5001
TCP window size: 50.0 KByte (WARNING: requested 25.0 KByte)
------------------------------------------------------------
[ 3] local 192.168.0.55 port 42550 connected with 192.168.0.56 port 5001
[ ID] Interval Transfer Bandwidth
[ 3] 0.0-180.0 sec 3.5 GBytes 169 Mbits/sec
ie the same.. so much for tha
| Mon, 8 July, 2002 21:57 |
Room D14, High Energy Particle Physics, Dept. of Physics & Astronomy, UCL, Gower St, London, WC1E 6BT