

Dynamic Right Sizing
Dynamic Right-Sizing provides automatic tuning of TCP flow control windows to support high bandwidth over high-latency (WAN) links. It improves TCP throughput by orders of magnitude over high delay-bandwidth links. It also keeps windows small for low-bandwidth and low-latency connections so they don't consume unnecessary amounts of memory.
Over the past decade, TCP has become the ubiquitous transport protocol
for the Internet. However, stock TCP performs absymally over high-bandwidth
or high-delay links (or more generally, networks with high bandwidth-delay
products). As a result, the performance of application infrastructures such
as computational grids and high-volume web servers, which are built on TCP,
is crippled.
To address this problem, grid and network researchers continue to manually
optimize buffer sizes to keep the network pipe full, and thus achieve acceptable
performance. Although such tuning can increase delivered throughput by an
order of magnitude, it requires administrator privledges and hence the changes
cannot be made by the end user. Instead, system administrators at the source
and destination hosts must separately configure their systems to use large
buffers; this process is tedious and time consuming. Furthermore, this manual
tuning only works well for the pair of hosts that are manually tuned. If
a TCP connection is split, as is the case with some kinds of firewalls,
the firewall administrators must also get involved.
Dynamic Right Sizing is a straightforward modification to TCP that automatically
and transparently addresses the above problems while maintaining connection
semantics and the ubiquitously deployed features of TCP.
A technique that eliminates the need for this manual process of tuning
system buffers. This technique, which can be implemented in the operating-system
kernel or in user space, results in nearly an order-of-magnitude increase
in throughput over a WAN while still abiding by TCP semantics.
In 2001, Feng and Fisk describe modifications to a Linux 2.4.8 kernel that
allow the kernel to tune the buffer size advertised by the TCP receiver.
The receiver's kernel estimates the bandwidth from the amount of data received
in each round-trip time and uses that bandwidth estimate to derive the receiver's
window. The sender's window is not constrained by the system default window
size but is allowed to grow, throttled only by the receiver's advertised
window. (The liux 2.4 kernel allows the sender's window buffer to grow.
For other OS's, the sender would have to be configured with a "big
enough" buffer.) The growth of the sender's congestion window will
be limited by currently available bandwidth. High delay, high bandwidth
flows will automatically use larger buffers (within the limits of the initial
window scale factor advertised by the receiver). No modifications are required
to either client or server network applications. Also see Allman/Paxon '99
paper on receiver-side bandwidth estimation.
Effects of DRS (dynamic right sizing - Feng)
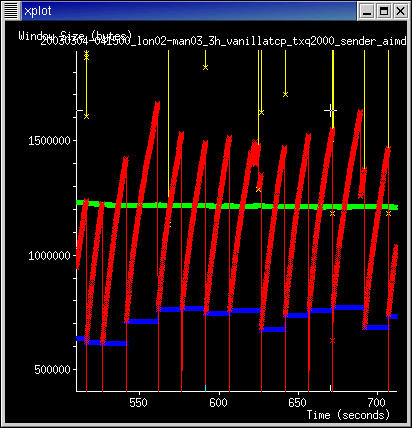
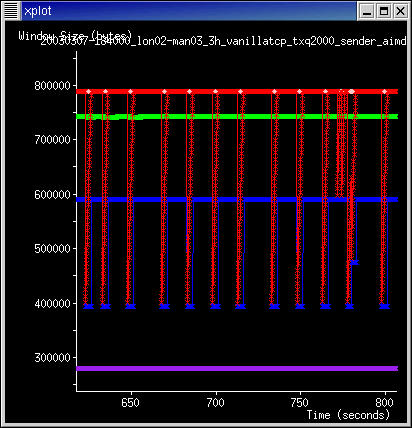
The graph on the right shows WITHOUT DRS; notice that the cwnd (in red) flucuates quite wildly. (the green is the average value of cwnd so far...). The graph on right shows that the cwnd value is capped - in this case to just under 800,000 - which is the bandwidth delay product of this link - 6e-3sec * 1e9 / 8 ~= 750,000 (the rtt reported by web100 is actually higher than the 6ms).
What i don't understand at the moment is why it keeps on going into slow start (i have graphs elsewhere). I suspect its to do with what web100 calls OtherReductions.... i'm investigating.
Moving onto cwnd dynamics:
Plot of Cwnd and DataBytesOut - i think the delta for the databytes out is more meaningful in this context as the cwnd is dynamic and thus we should be looking at what effect this has on the number of bytes leaving the sender...
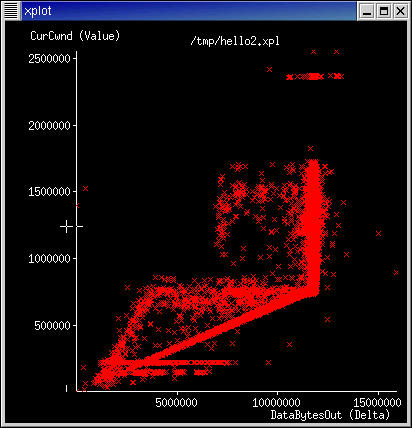
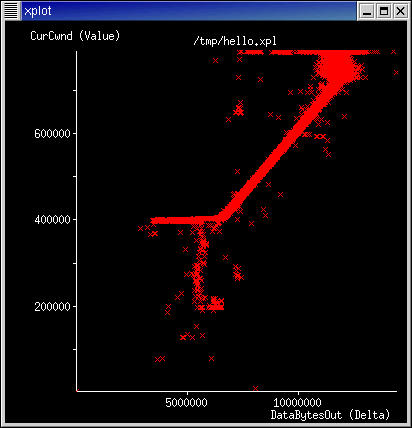
Again, we have the drs enabled one on the right: and the standard on the left.
For the standard one, we appear to have two main regions: the linear increase - representing that there is a direct relation betweeen the cwnd and the number of bytes allowed out, and then we have the second which represents that we've reached the maximum line rate (notice that there are some points beyond this region - it happens). The other bits of the graph are usually to do with the way tcp handles errors and stuff. A filtering process on some other variables would show this.
The drs one is much nicer - we have the same linear bit; but as drs caps the cwnd value, we get a small cluster and spread at the top. there is also a plateau at the bottom - you tell me! it says to me that for a value of cwnd, it's gonna send out a range of bytes... does it make sense?
But then again, the picture on the right looks like an emu to me....
I've included a variable called InstaneousWindow in the logvars list, it is snd_nxt-snd_una and represents the size of the sliding window of tcp. I'm not sure if this variable works very well (bad coding?) as it's often 0. But looking at the value of the variables, there is a difference.
| Wed, 23 July, 2003 13:29 |
Room D14, High Energy Particle Physics, Dept. of Physics & Astronomy, UCL, Gower St, London, WC1E 6BT