Figure w: true vs estimated center of mass energy, no photon filter
Figure w: true vs estimated center of mass energy, no photon filter

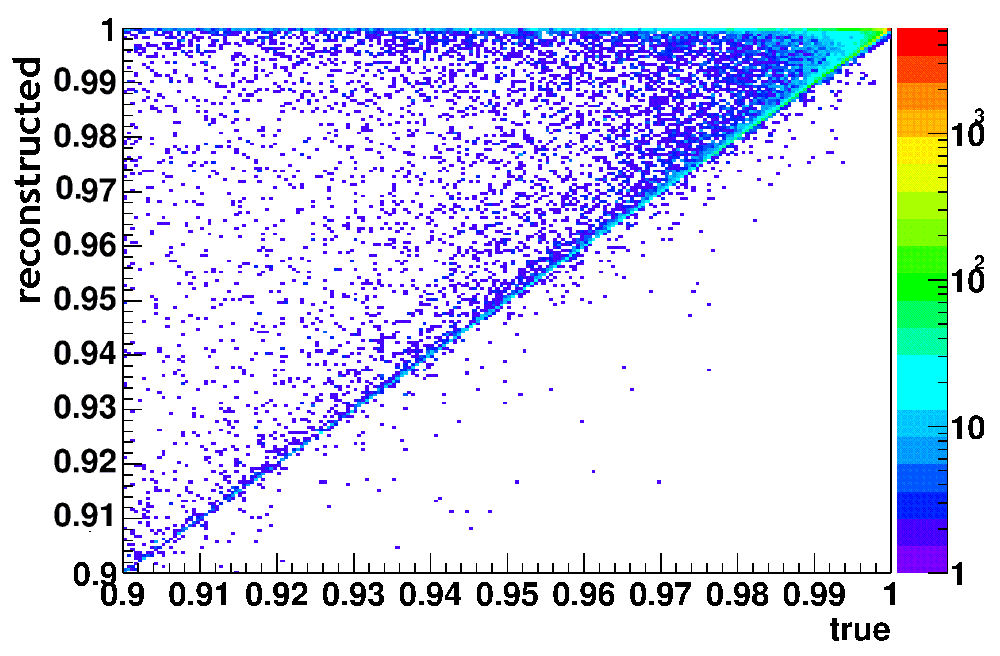
Figure x: true vs estimated center of mass energy, events with less than 2 photons
Filtering events that have radiated only one photon removes what is probably the main cause of discrepancy between the true centre of mass energy of an interaction and that estimated with the Frary-Miller approximation. This is best exemplified by figs w and x: a surface plot where true versus estimated centre of mass energies are plotted as scatter points. In both plots the vast majority of events are in the small area surrounding (1,1). In the unfiltered data plot, there exists a real correlation, but there is also a significant number of reconstructed events that are too low. In the filtered data, it is these events that are filtered out.
The photon cuts improve the reconstruction mostly in the area above 97% of nominal energy: they give a good estimate of the ratio between events in the top 1% and the rest (last bin.) Artificially de-correlating events improves the spectrum below this~97% limit—but does not significantly improve the accuracy above that limit. Combining these results with endcap calorimeter measurements is probably the solution that will be used.
Table 1: fraction
of area up to last bin : True spectrum Rec. (Miller) difference Angle filter only 5.10% 23.70% 18.60% 1 photon filter 26.90% 29.25% 2.35% decorrelated 27.00% 29.40% 2.44%
The detector question is also an important one: the forward trackers can give a high precision measurement of the angles (~20-39 μrads in our range), but they are likely to have only 90% efficiency, which is not enough for good luminosity monitoring. However, the whole region is backed by the CALICE calorimeter, which can give 100% efficiency in detecting high-energy electrons. Thus combining the two should probably be done.
To account for the early-late bunch correlation, there is a possibility of using the LCAL small angle calorimeter (5-27 mrads.) This is not adequate for luminosity monitoring due to the angular range, and the errors that this induces, but its background rate may be used in giving a rough bunch-wide luminosity estimate, as well as an early-late correlation correction.
The success of the luminosity spectrum reconstruction can only be thought of in the context of its purpose. For the purpose of extracting the top mass and width from the top cross section, it has been shown that the spectrum needs to be know to 0.1%, or 1 part in 10-3. For the W parameters, an accuracy ten times greater is required. We have progressed in finding limits in which one of the reconstructions gives acceptable results, but work needs to be done in evaluating the exact effect on the top mass and width, to know just how acceptable the reconstruction is for precision measurements. This, and the generation of the theoretical top cross section should be done using a top fitting program,. This was not done because of time constraints, as well as the fact that the top fitting program is soon to be released.[teubner et al]