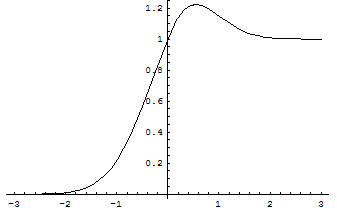
Figure s: top cross section function
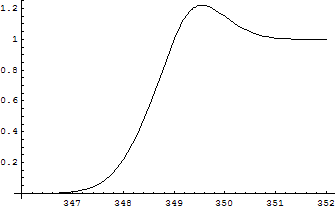
Figure p: top cross section function, as used shifter by 2mtop~349
GeV
We investigate the effect of the luminosity spectrum on the observed top quark production cross section.
Figure s: top cross section function
Figure p: top cross section function, as used shifter by 2mtop~349
GeV
In the absence
of a top quark cross section generator, and of a top mass and width fitter,
we construct a function that mimics the top cross section, and evaluate the
effect on it qualitatively.
The function is of form
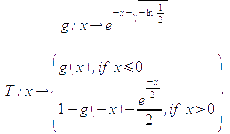
which is an easily computable piece-wise function.
Figure s shows the function plotted "as is."
Figure p shows the function plotted with a shift of 349 GeV, approximately 2mtop. So in practice, we plot:
![]()
taking 2mtop = 349 GeV,
and our function models Γtop ~ 3.
To smear the cross section, we treat the luminosity spectrum as a probability distribution, so that at every point, the degraded top cross section is given by:
![]()
where:
y = x – 2mtop
L(y) is the luminosity spectrum
T(y) is the top cross section function
y' an integration variable
This is readily done computationally for every point, and holds mathematically because of the normalisation of the luminosity spectrum.
|
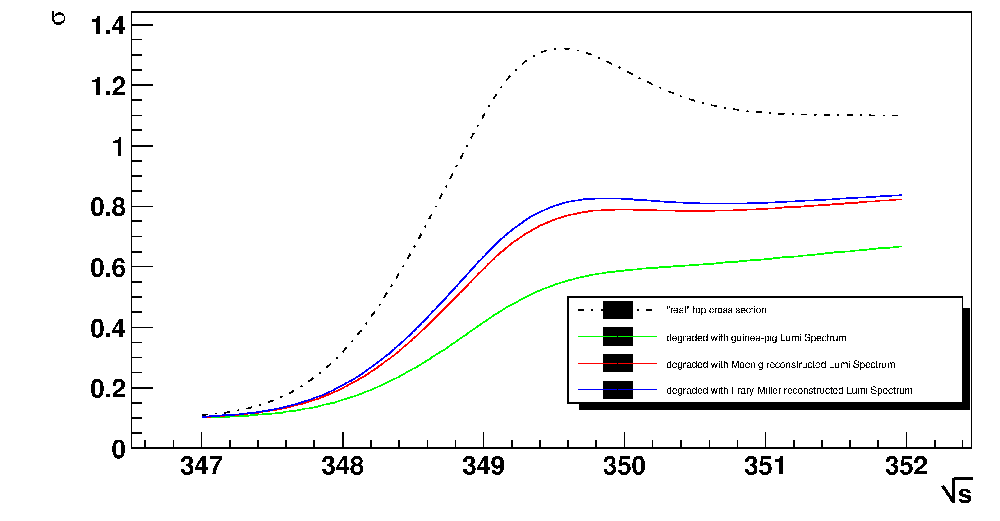
The same colours are used for the true and reconstructed spectra: in green, the true spectrum. In red, the K. Monig reconstruction method. In blue, the Frary-Miller reconstruction method. This graph shows that there is a significant difference when the top cross section is degraded by the true and reconstructed spectra. This is mostly due to the fact that the sharpness of the peak is not reconstructed accurately: so the reconstructed luminosity degrades far less than the true luminosity. |
Figure t: top cross section,
degraded by true and reconstructed spectra |
|
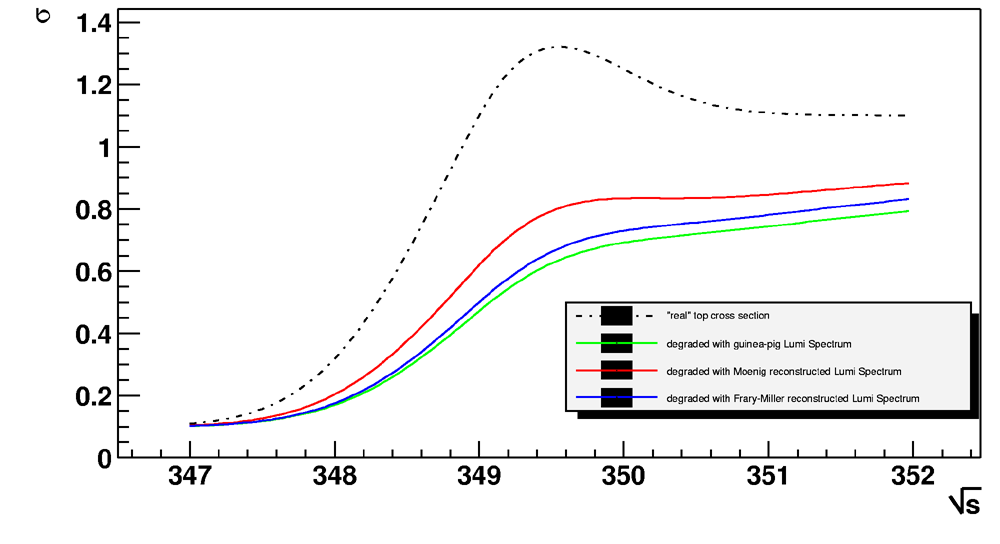
When using events that have only radiated one photon, as in figure u, the cross section degraded by the Frary-Miller reconstructed spectrum is much closer to the true degradation than without the 1 photon cut. This is due to the accurate
prediction of the top bin events. |
Figure u: top cross section, degraded
by true and reconstructed spectra, with 1 photon cut |
|
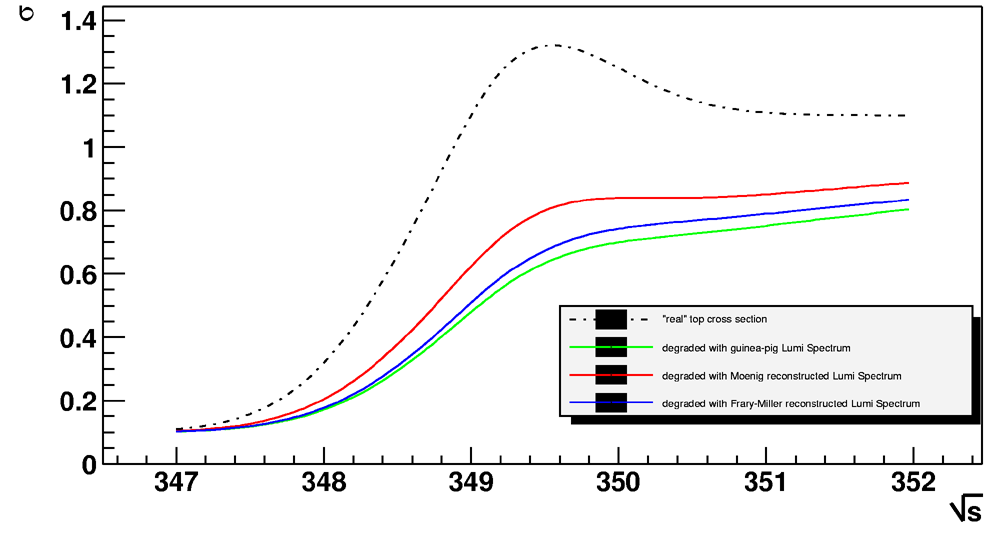
As mentioned earlier, the de-correlation of events in the bunch does not bring much to the top cross section degradation, as it mostly corrects effects below 97% of √Snom . |
Figure v: top cross section, degraded
by true and reconstructed spectra, with 1 photon cut and de-correlation
|