Figure 9.2 shows the total differential cross-section for the production of W-pairs and the differential cross-section for the production of two transversely polarised W bosons, two longitudinally polarised W bosons and the production of W bosons of opposite polarisation. All these were obtained from the 189 GeV data by the procedure described in the previous chapter.
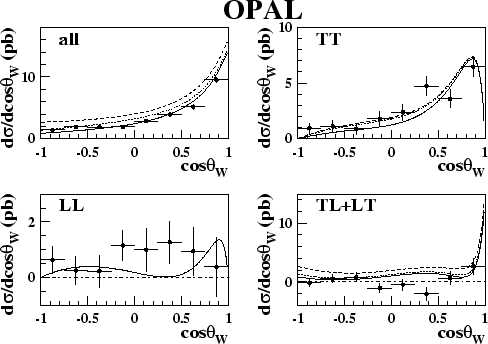 |
Integrating over
![]() and dividing by the total cross-section will once again give the fraction of each helicity state. The results for this are shown in
table 9.2. The areas of systematic uncertainty are described
in chapter 10 and the overall systematic uncertainty is added in
quadrature with the statistical error. The fractions are highly correlated and
the correlations are obtained directly from the data by a statistical analysis on an event by event basis.
The following correlations are
obtained for the 189 GeV data:
and dividing by the total cross-section will once again give the fraction of each helicity state. The results for this are shown in
table 9.2. The areas of systematic uncertainty are described
in chapter 10 and the overall systematic uncertainty is added in
quadrature with the statistical error. The fractions are highly correlated and
the correlations are obtained directly from the data by a statistical analysis on an event by event basis.
The following correlations are
obtained for the 189 GeV data:
Using the results in table 9.2 and taking into consideration
the above correlations, the ![]() value of the three measurements compared
to the Standard Model expectations, including systematic uncertainties, is 4.7.
This corresponds to a
value of the three measurements compared
to the Standard Model expectations, including systematic uncertainties, is 4.7.
This corresponds to a ![]() probability of 10%. Also shown in table 9.2 are the total cross-sections for the production of the different
W-pair polarisation states. These were calculated using the total cross-section
for W-pair production at 189 GeV measured at OPAL.
probability of 10%. Also shown in table 9.2 are the total cross-sections for the production of the different
W-pair polarisation states. These were calculated using the total cross-section
for W-pair production at 189 GeV measured at OPAL.