The CP-conserving couplings were measured using a SDM analysis with the inclusion of information about the W production angle.
Measurements of the CP-conserving TGCs were undertaken using two different Monte Carlo reweighting methods, the WVCXME and BILGOU programs. The results using the two methods were found to be consistent. Measurement of the CP-violating couplings could only be done using the BILGOU program. For consistency, the final quoted results for the CP-conserving couplings will be those measured using the BILGOU program.
The measured values of the CP-conserving TGCs, with the
![]() gauge
invariance constraints, including systematic uncertainties were found to be,
gauge
invariance constraints, including systematic uncertainties were found to be,
These results are consistent with the Standard Model expectations and the published OPAL results for the 189 GeV data, where an optimal observable method was used to measure them [104].
The CP-violating couplings have been measured for the first time at OPAL.
Measurements of the WW![]() CP-violating couplings have been made at ALEPH
[59,60], the DELPHI collaboration [63]
and at the Tevatron [61,62]. ALEPH also measured the CP-violating
WW
CP-violating couplings have been made at ALEPH
[59,60], the DELPHI collaboration [63]
and at the Tevatron [61,62]. ALEPH also measured the CP-violating
WW
![]() coupling. All these couplings were measured without the
coupling. All these couplings were measured without the
![]() gauge invariant
constraints, so all other couplings were set to zero.
All results are consistent with Standard Model expectations.
gauge invariant
constraints, so all other couplings were set to zero.
All results are consistent with Standard Model expectations.
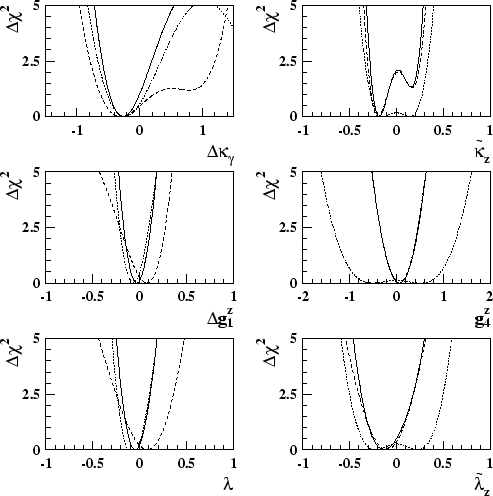
Figure 11.2 shows the ![]() plots for all the TGCs measured
in this thesis. It was seen that the CP-conserving couplings have a greater
effect on the shape of the
plots for all the TGCs measured
in this thesis. It was seen that the CP-conserving couplings have a greater
effect on the shape of the
![]() distribution than on the SDM elements and
the converse was true for the CP-violating couplings.
distribution than on the SDM elements and
the converse was true for the CP-violating couplings.
 |