

![]()
![]()
![]()
![]()
![]()
![]()
![]()
![]()
![]()
![]()
![]()
![]()
![]()
![]()
![]()
Udpmon investigation into send_data_rate
Background
When using udpmon (v3.0), there appears to be an anomoly whereby the send_data_rate variable behaves strangely. Formally, send data rate is defined as:
send_data_rate = (number_of_pkts * pkt_size * 8) / send_time
Udpmon specifies two other variables:
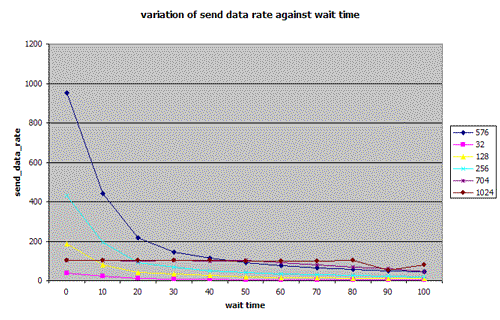
wait_time = the amount of time for udpmon to wait between sending one packet and the next. Formally, this is the time between sending the first bit of the first packet to the first bit of the second packet.
send_time = the total amount of time taken to send all of the packets, excluding the time between packets.
As such, the inter packet time between packets is defined as the
inter_pkt_time = wait_time - send_time
Problem
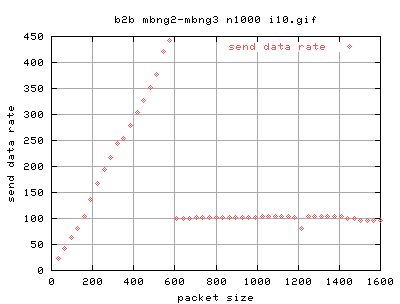
When plotting the sending rate, we should get a smooth increase in throughput as we increase the packet size; however, we get a sudden drop in the send_data_rate past a certain packet size. The interesting thing to note is that as we increase the packet size, we get a corresponding linear increase in the send_data_rate (as expected). However, past a packet size of about 600bytes, we get a sudden drop in the sending rate. Note that these experiments were conducted back to back on a 100mbit nic. The send_data_rate, once past this packet size, is actually very well regulated by the physical limitations of the nic. But below this value, udpmon attempts to send much more that the nic could possibly manage (possibly creating a sendstall).
Buffers?
The first idea was that the sudden drop could be caused by a buffer overflow; that the small packets would accumulate up and sent out in bursts. this would imply that there is a finite buffer size being used. Therefore, as this buffer size is constant, if we vary the number of packets being sent out, we should see a shift in the peak of the graph to a larger packet size.
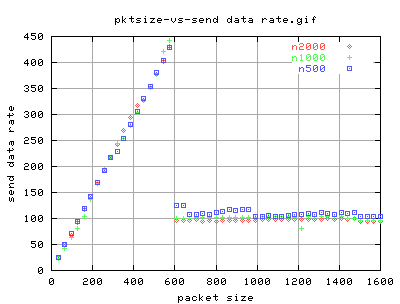
The above graph shows the same settings, different numbers of packets being sent. As you can see, there is no obvious difference between the graphs. Except for the accuracy of the results caused by the number of packets used and hence the increase in statistics. The combination of these graphs imply that the program is attempting to send at a much greater rate than possible with the interface card (100mbit in this case). However, past about 600bytes packet size, the send_data_rate is fine; at a steady rate of 100mbit/sec.
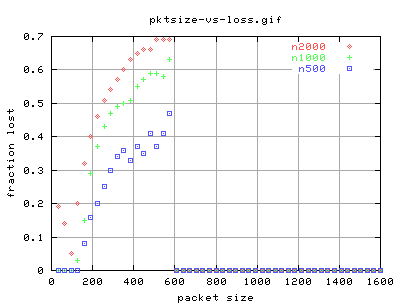
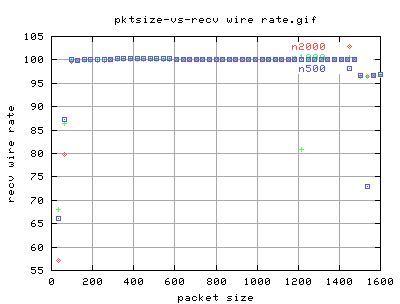
The above plots correspond to the same data as that of the other gnuplot graph above (with the three colours). As you can see, there is a huge loss of packets when we have a small packet size. However, this does not seem to affect the recv_wire_rate (ethernet rate).
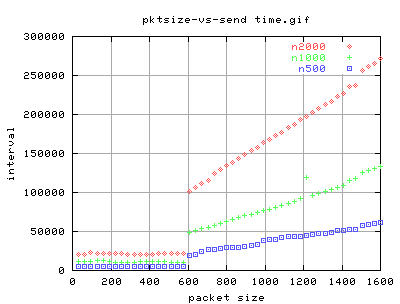
Looking into the variables that form the send_data_rate, we can see that the send_time (the interval here - which is incorrectly labelled), looks funny. For packet sizes less than 600, we get a constant send_time for all packet sizes; the difference in the send_time values is related to the fact that we have to send more packets (which takes longer). Then at 600 and above, we get a linear relation between the packet size and the send_time. The region of small packet sizes have a constant send_time (test duration) which can be described as follows:
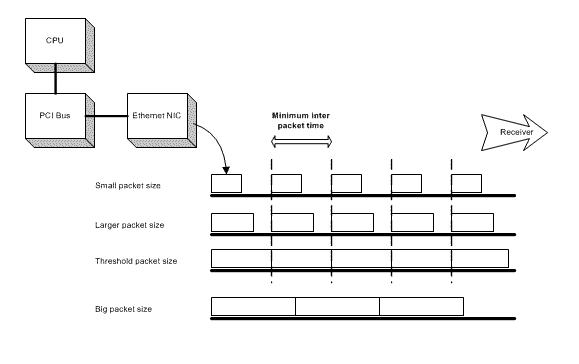
There is a physical limit in the rate at which data can be delivered onto the network; in ethernet this is 12bytes. We can use this idea to understand why the send_time does not change for packet sizes smaller than 600bytes. The figure about shows the delivery of packets from a host to the network. For 'small packet sizes', we can see that there is a inter packet gap between packets. With a slightly larger packet size, we get a smaller gap - but we still get a gap. We can no get rid of this gab simply because of a limit imposed by the technology (at whatever layer). If we increase the packet size further, then we essentially send the packets 'back to back' - this is known as the threshold packet size in the figure. As we increase the packet size further, we see a shift as we are no longer imposed by the minimum inter packet time. However, we would expect a gradual increase in the inter packet time.
This does not seem to be the case in the graph above (packet-size against interval (test duration)). Why?
| Wed, 23 July, 2003 13:07 |
Room D14, High Energy Particle Physics, Dept. of Physics & Astronomy, UCL, Gower St, London, WC1E 6BT