NEMO-3
The NEMO collaboration started working on ββ decay in the early 1990's, developing the two prototypes, NEMO-1 and NEMO-2, that ultimately led to the NEMO-3 Detector. NEMO-3 was located in the Laboratoire Souterrain de Modane (LSM) on the French-Italian border in a tunnel linking Modane to Bardonecchia. It had a cylindrical design and was divided into 20 equal sectors.
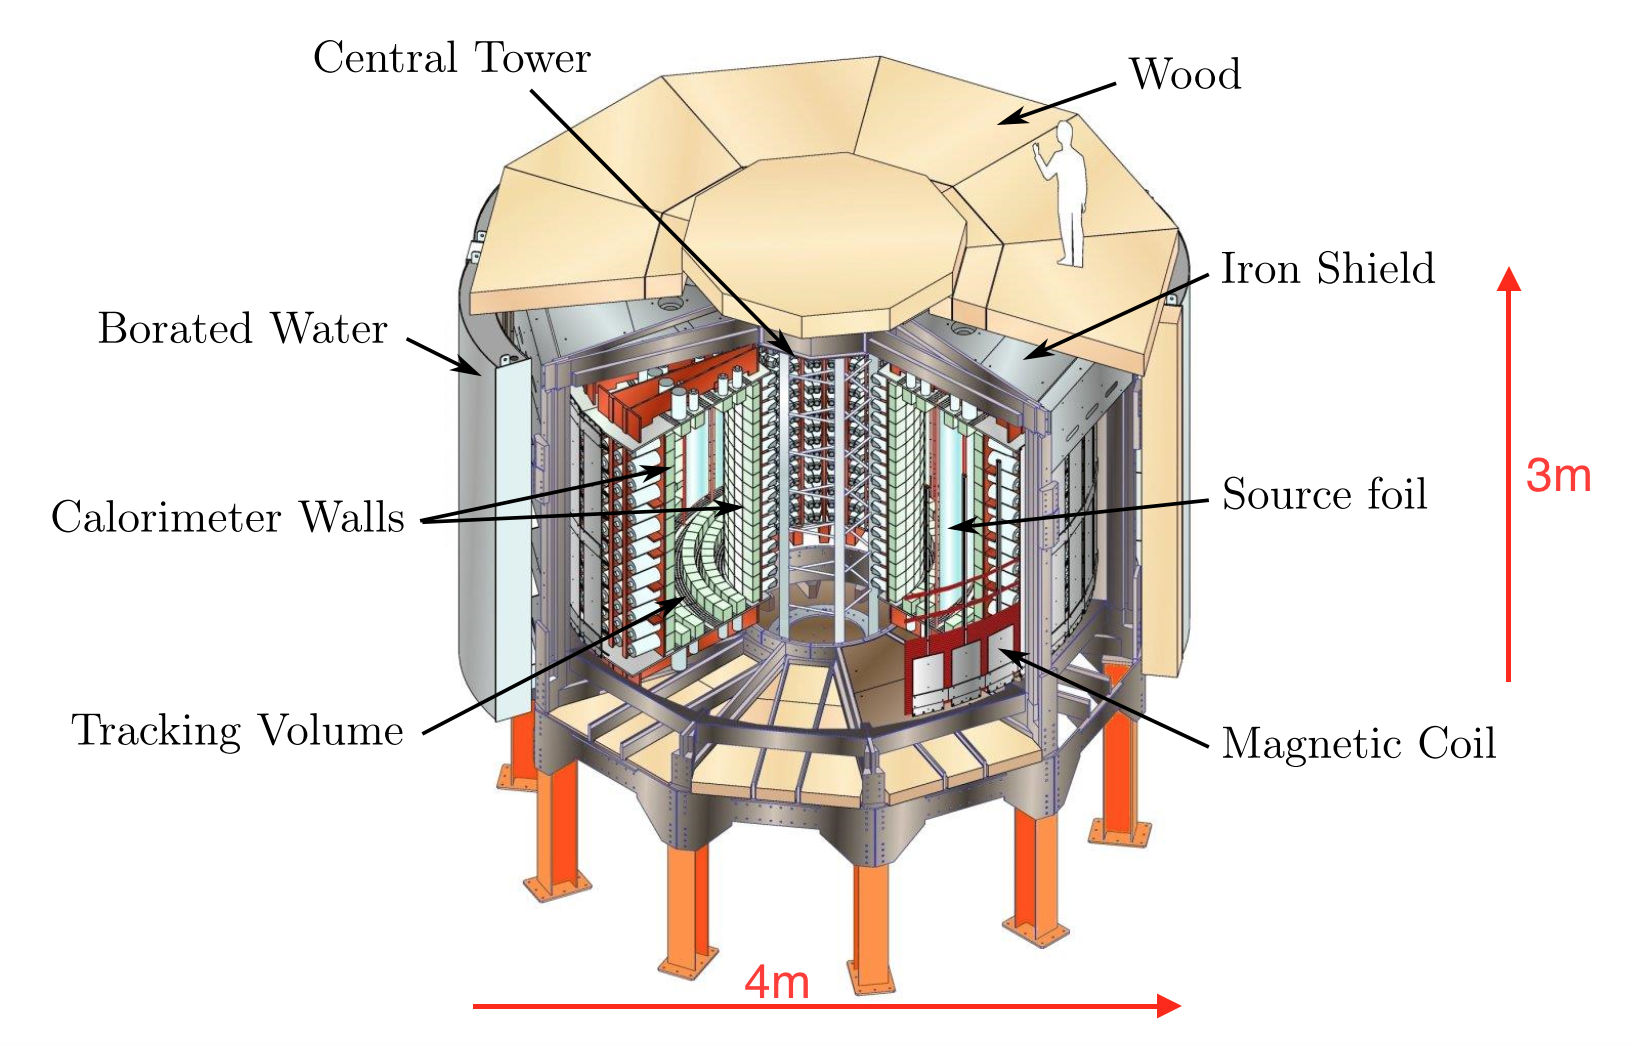
Main Components of the NEMO 3 Detector:
Calorimeter
Each of the 1940 calorimeter counters was made of a block of plastic scintillator, light guide and photomultiplier tube. The counters covered the cylindrical walls surrounding the tracking volume of the detector, and provided a partial coverage of the top and bottom end caps.
Tracking Detector
The volume of the tracking detector was made up of vertical (Geiger) drift cells, and was filled with a mixture of helium gas (95%), ethyl alcohol (4%) and argon (1%), with a very small admixture of water vapour.
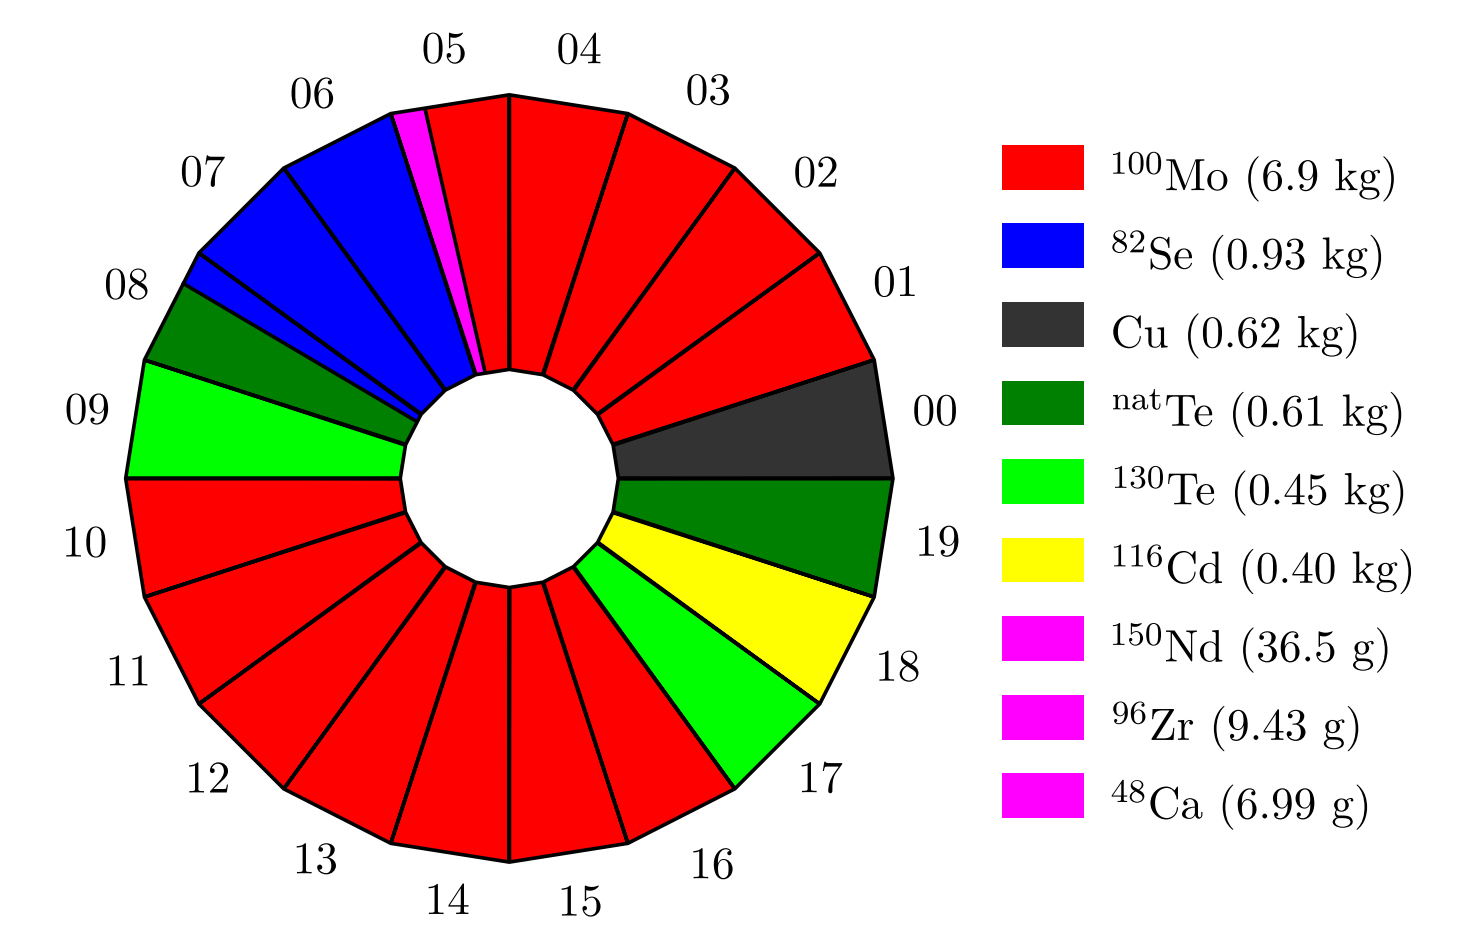
Source Foils
The detector contained about 10kg of ββ isotopes, distributed throughout the detector in source foils. One of the unique features of the NEMO-3 detector was its ability to study double beta decay processes for seven different isotopes simultaneously.
To download the NEMO3 Technical Design Report click here.
NEMO-3 Results
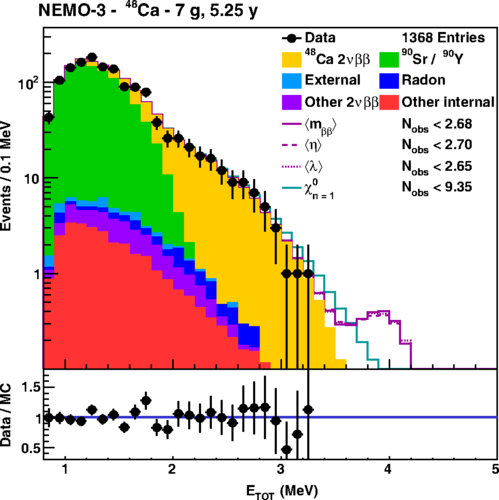
NEMO-3 was collecting physics data between 2003 and 2011. It obtained the world's most accurate measurements of the two-neutrino double beta decay half-lives for all seven of its source isotopes, and placed the most stringent constraints on new physics for most of those isotopes. At UCL, we have directly contributed to the analysis of five of the seven NEMO-3 isotopes.
Most results have already been published but there are a few analyses that are still being finalised. An example of the recently published analysis of 48Ca double beta decay, led by UCL, is shown below.